Avoid False signal use this 2 AFLS for Amibroker (AFL)
MANGESHSP over 9 years ago Amibroker (AFL)
Most of Signal given by AFLs give false signal. due to this day traders endup with losses. To avoid false signal
I am submitting 2 AFL combination for detection of False signal.
1) Swing tread with BUY & Sell signal AFL
2) MACD AFL
I have not written this 2 AFL’s. (this afl’s are already available on net)
Just arrange this 2 AFLs on single screen and
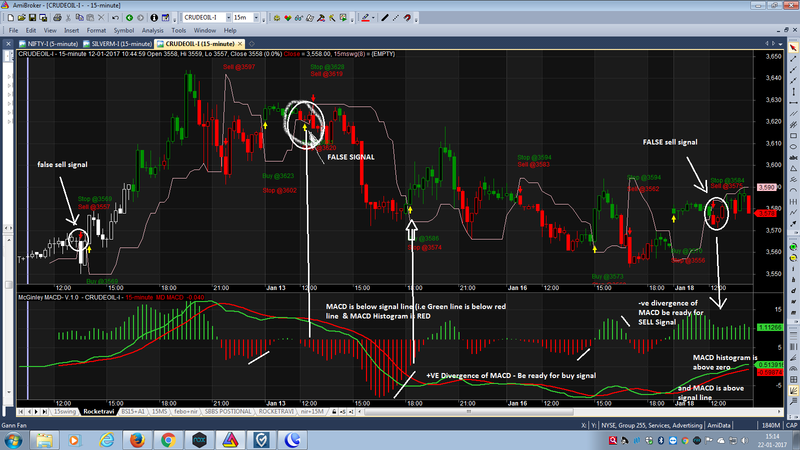
1) check FOR false BUY Signal :- if MACD is below signal line & MACD Histogram is below zero (i.e red colour bar), then BUY signal is false.
2)Check for FALSE SELL Signal :- If MACD is above signal line(red line) & MACD Histogram is above zero, then Sell signal is false.
3) Check for MACD histogram divergence. Check : if MACD Divergence is positive – then be ready for buy signal, if MACD divergence is negative – sell signal is near.
4) take bar testing in 15Min & 5min, and use .
Above interpretations are not new, all are available in the theory of MACD, I hav back tested, it works reasonably well.
Happy & Profitable treading…!
Mangesh
Screenshots
Indicator / Formula
//1st AFL - Swing tread with BUY & Sell signal AFL

_SECTION_BEGIN("Price");
SetChartOptions(0,ShowArrows|ShowDates);
_N(Title = StrFormat("{{NAME}} - {{INTERVAL}} {{DATE}} Open %g, Hi %g, Lo %g, Close %g (%.1f%%) {{VALUES}}", O, H, L, C, SelectedValue( ROC( C, 1 ) ) ));

SD = StochD(8, 3, 3);
MH = MACD(8, 21) - Signal(8, 21, 5);

trendup = IIf(MH > 0 OR (MH > 0 AND MH > Ref(MH, -1)) AND RSI(3) >50 AND SD < 80 AND SD > Ref(SD, -1) AND ValueWhen(C,O<C), colorGreen, colorWhite);
trendcolor = IIf(MH < 0 OR (MH < 0 AND MH < Ref(MH, -1)) AND RSI(3) <50 AND SD > 20 AND SD < Ref(SD, -1) AND ValueWhen(C,O>C), colorRed, trendup);
Plot( C, "Close", trendcolor, styleCandle | styleThick );

_SECTION_END();

no=Param( "Swing", 8, 1, 55 );

res=HHV(H,no);
sup=LLV(L,no);
tsl=IIf(ValueWhen(IIf(C>Ref(res,-1),1,IIf(C<Ref(sup,-1),-1,0))!=0,IIf(C>Ref(res,-1),1,IIf(C<Ref(sup,-1),-1,0)),1)==1,sup,res);

Plot(tsl, _DEFAULT_NAME(), colorPink, styleLine);
Buy = Cross(C,res) ;
Sell = Cross(sup,C)  ;
_SECTION_END();

a=C;
g=(EMA(Close,3) * (2 / 4 - 1)-EMA(Close,5) * (2 / 6 - 1)) / (2 /4- 2 /6);
e=Ref(tsl,-1);
Buy = Cross(C,tsl) ;
Sell = Cross(tsl,C)  ;
SellPrice=ValueWhen(Sell,e,1);
BuyPrice=ValueWhen(Buy,e,1);
Long=Flip(Buy,Sell);
Shrt=Flip(Sell,Buy );
Filter=Buy OR Sell;
Buy = Cross(C,tsl) ;
Sell = Cross(tsl,C)  ;
shape = Buy * shapeUpArrow + Sell * shapeDownArrow;

PlotShapes( shape, IIf( Buy, colorYellow, colorRed ),0, IIf( Buy, Low, High ) );
a1=Ref(tsl,-1);
GraphXSpace = 5;
dist = 2*ATR(5);
for( i = 0; i < BarCount; i++ )
{if( Buy[i] ) PlotText( "Buy @" + a1[ i ], i, L[ i ]-dist[i], colorGreen );
if( Sell[i] ) PlotText( "Sell @" + a1[ i ], i, H[ i ]+dist[i], colorRed);
}


GraphXSpace = 5;
dist = 2.5*ATR(5);
for( i = 0; i < BarCount; i++ )
{if( Buy[i] ) PlotText( "Stop @" + tsl[ i ], i, L[ i ]-dist[i], colorRed );
if( Sell[i] ) PlotText( "Stop @" + tsl[ i ], i, H[ i ]+dist[i], colorGreen);
}


// **** 2nd  MACD AFL

//Indicator McGinley MACD
// Public release for personal use only.

_SECTION_BEGIN("McGinley MACD - V.1.0");
SetChartOptions(0,ShowArrows|ShowDates);
Output[0] = C[0];
for( i = 1; i < BarCount; i++ )
{
output[ i ] = output[ i - 1 ] + (C[i]-Output[i-1])/( 12*(C[i] / Output[i-1])^4)  ;
}


Outputa[0] = C[0];

for( i = 1; i < BarCount; i++ )
{
outputa[ i ] = outputa[ i - 1 ] + (C[i]-Outputa[i-1])/( 26*(C[i]  / Outputa[i-1])^4)  ;
}


MDM = Output-Outputa;

Plot(mdm,"MD MACD",colorLime,1| styleThick);
Plot(MA(mdm,9),"Md Signal",colorRed,1| styleThick);
Hist =mdm-MA(mdm,9);
Plot(Hist,"",IIf(Hist>0,colorLime,colorRed),2| styleThick|styleOwnScale);
_SECTION_END();
_SECTION_BEGIN("Title");
if( Status("action") == actionIndicator )
(
Title = EncodeColor(colorWhite)+ "McGinley MACD- V.1.0 " + " - " +  Name() + " - " + EncodeColor(colorRed)+ Interval(2)+
WriteIf(MDM > MA(mdm,9), EncodeColor(colorLime) + "  MD MACD = ", EncodeColor(colorRed)  + "  MD MACD")+ WriteVal(MDM));

_SECTION_END();
18 comments
Leave Comment
Please login here to leave a comment.
error ln4 col 39
@kokofibo pls use this AFL
error 57
Ln: 7, Col: 22
@ kokofibo
I dont know how it shows error, ok u can download afl in below link
AFL 1) https://dl.dropboxusercontent.com/u/62731433/15min%20Swing%20GOOD1.txt
AFL 2) https://dl.dropboxusercontent.com/u/62731433/MACD%20GOOD.afl
afl is work but no signal arrow sir
thank you sir
Thank you for the code.Excellent .One may also use ADX to avoid Sidewards and Trendless phases in PRICE.When ADX is falling from high values say above 40-60 avoid trades or Ignore signals to BUY or Sell.Take Signals only when ADX rises from below 20-30,Indicating STRENGTH in the TREND ,with PRICE DIRECTION as shown by MACD.Thanks.
Hi Venkatgr
Thanks for feedback.
ADX indicator is really useful to avoid false signal.
Thank you
Replace
SetChartOptions(0,ShowArrows|ShowDates);
on
SetChartOptions(0,chartShowArrows|chartShowDates);
I used 2ndd afl but no target or exit price or symbol to book profit….
how do i load the 2 indicators ?
I have a question about 1st AFL.
Why there are two sets of buy/sell statements?
In such scenario, which buy/sell signal are fired?
Thank you for the code.
thx so much for your code, it is very useful, can it also use in short trade?
@ Ken20111
It will be useful for 15Min timeframe
It seems very profitable to me, i want to backtest it, and if it’s really profitable, i will do auto trading by this. Thus, do you mind add the 2nd AFL criteria into the 1st AFL for backtesting/autotrading?
Yes, Ken20111 it is a profitable One, but I m negative on Auto treading. Pls avoid auto trading. As theoretically auto trading seems very profitable but ground reality is far away. Take wise decision. Good luck
hi sir its showing error can u upload again thanking you