Rotasi Saham / Stock Rotation XY-Chart for Amibroker (AFL)
newbie123 over 4 years ago Amibroker (AFL)
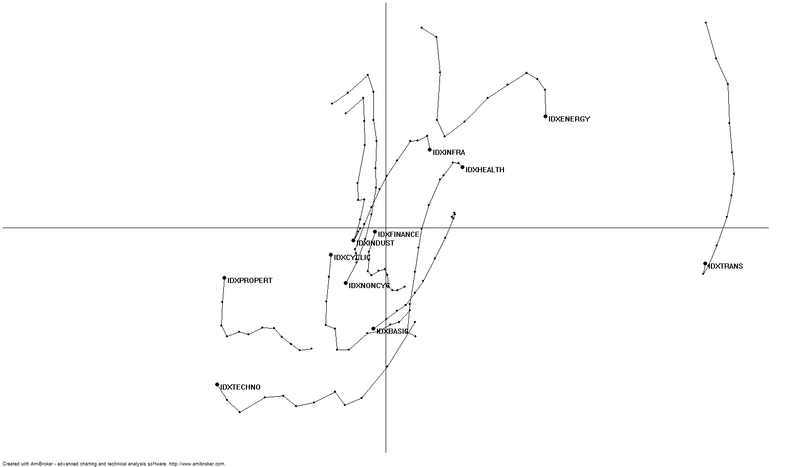
Rotasi Saham digunakan untuk memetakan saham yang outperform / underperfom dibandingkan index acuan, ke dalam 4 kuadran XY chart.
Kuadran:
- Kanan atas = Leading
- Kanan bawah = Weakening
- Kiri bawah = Lagging
- Kiri atas = Improving
Ini adalah versi kode paling dasar yang dibutuhkan.
Silakan menambahkan warna dan tulisan untuk masing2 kuadran sesuai keinginan kalian.
(translation)
Stock rotation is used to map stocks that outperform / underperform compared to the reference index, into 4 quadrants of the XY chart.
Quadrant:
– Top right = Leading
– Bottom right = Weakening
– Bottom left = Lagging
– Top left = Improving
This is the most basic version of the code needed.
Do add colors and text for each quadrant as you wish.
Screenshots
Indicator / Formula
_SECTION_BEGIN( "XY-Rotation Chart" );

_N( base = ParamStr( "Base", "IHSG" ) );
_N( list = ParamStr( "Symbols", "IDXBASIC,IDXCYCLIC,IDXENERGY,IDXFINANCE,IDXHEALTH,IDXINDUST,IDXINFRA,IDXNONCYC,IDXPROPERT,IDXTECHNO,IDXTRANS" ) );
tbar = Param( "Trailing Bar", 12, 1, 100, 1 );

EnableTextOutput( False );
GfxSetOverlayMode( 2 );

pxl = Status( "pxchartleft" );
pxr = Status( "pxchartright" );
pxt = Status( "pxcharttop" );
pxb = Status( "pxchartbottom" );
pxw = ( pxr - pxl ) / 2;
pxh = ( pxb - pxt ) / 2;
xm = pxl + pxw;
ym = pxt + pxh;

GfxMoveTo( pxl, ym );
GfxLineTo( pxr, ym );
GfxMoveTo( xm, pxt );
GfxLineTo( xm, pxb );

function getrs ( sc, t )
{
    bc = Foreign( base, "C" );
    sbr = sc / bc;

    rs1 = MA( sbr, 12 );
    rs2 = MA( sbr, 26 );
    rs = 100 * ( ( rs1 - rs2 ) / rs2 + 1 );

    rm1 = MA( rs, 1 );
    rm2 = MA( rs, 9 );
    rm = 100 * ( ( rm1 - rm2 ) / rm2 + 1 );

    return IIf( t, rs , rm ) - 100;
}

function drawpos ( x, y, sym, text )
{
    rsl = VarGet( "rsl" );
    rsh = VarGet( "rsh" );
    rml = VarGet( "rml" );
    rmh = VarGet( "rmh" );

    xx = pxl + pxw + x * ( pxw / ( Max( rsh, -rsl ) * 1.10 ) );
    yy = pxb - pxh - y * ( pxh / ( Max( rmh, -rml ) * 1.10 ) );

    xp = Nz( VarGet( "xp" + sym ), xx );
    yp = Nz( VarGet( "yp" + sym ), yy );

    VarSet( "xp" + sym, xx );
    VarSet( "yp" + sym, yy );

    GfxMoveTo( xp, yp );
    GfxLineTo( xx, yy );

    GfxCircle( xx, yy, IIf( text == "", 2, 4 ) );

    if ( text != "" ) GfxTextOut( sym, xx + 6 , yy - 3 );
}

for ( i = 0; ( sym = StrExtract( list, i ) ) != ""; i++ )
{
    SetForeign( sym );

    rs = getrs( C, 1 );
    rm = getrs( C, 0 );

    for ( ii = BarCount - tbar; ii < BarCount; ii++ )
    {
        rs_ = rs[ ii ];
        rm_ = rm[ ii ];

        rsh = Nz( VarGet( "rsh" ), rs_ );
        if ( rs_ >= rsh )
            VarSet( "rsh", rs_ );

        rsl = Nz( VarGet( "rsl" ), rs_ );
        if ( rs_ <= rsl )
            VarSet( "rsl", rs_ );

        rmh = Nz( VarGet( "rmh" ), rm_ );
        if ( rm_ >= rmh )
            VarSet( "rmh", rm_ );

        rml = Nz( VarGet( "rml" ), rm_ );
        if ( rm_ <= rml )
            VarSet( "rml", rm_ );
    }

    RestorePriceArrays( True );
}

for ( i = 0; ( sym = StrExtract( list, i ) ) != ""; i++ )
{
    SetForeign( sym );

    rs = getrs( C, 1 );
    rm = getrs( C, 0 );

    for ( ii = BarCount - tbar; ii < BarCount; ii++ )
    {
        drawpos( rs[ ii ], rm[ ii ], sym, WriteIf( ii == BarCount - 1, sym, "" ) );
    }

    RestorePriceArrays( True );
}

_SECTION_END();
29 comments
Leave Comment
Please login here to leave a comment.
hi
chart empty , only 4 quadrants showed .
thanks
in line 3, change the name of the index/stock you want to use as a reference/base
in line 4, change the name of the stock you want to display on the chart
ok , thanx for replay
Thanks a lot for you contribution by share this AFL ,
to user :
please visit this link : https://www.optuma.com/relative-rotation-graphs/
to more understand how this afl work.
how can i change color and draw line for this indicator. please help me!
Thank you very much…
You inspired me and helped me improve the code. As a result, I was able to achieve the following result…
Thanks again…
Very nice TigerXXX. Good job and happy for you.
Hi TigerXXX can you share your code please.
Hi TigerXXX,
Can you share your code with the color please?
Thank you for your sharing.
Hi TigerXXX,
Can you share your code with the color please?
Thank you for your sharing.
How to use colours add names for 4 quadrants?
Thank you for sharing. Its quite helpful
Thanks for your sharing, exactly what I was looking for. respect your contribution
Hi TigerXXX,
Could you share with me your code with color please?
Thank you very much in advance!
thank bro for share
thank bro for your share
Hi TigerXXX can you share your code please.Thank you in advance!
Di ami sy tampilan nya blank ya ?
Halo gan, boleh share contact telegram atau WA? mau minta tolong ada project. Salam.
bang kok g ada gambarnya. gimana cara gunainnya
Hi,
apakah angka pada parameter MA merupakan defaultnya atau bisa di set up lagi ? Tks.
@t3nsai @alwi afgani, di baris ke 3 dan ke 4, sesuaikan dengan kode index dan kode saham yang ada di amibroker mu. Atau bisa klik kanan di chart —> parameter —> bisa ganti/ubah2 di situ.
@iwan, saya pakai default MACD, tentu bisa di adjust sesuai kenyamanan masing2.
@newbie123 tks atas penjelasannya.
Apakah bisa di share coding awal utk
menghasilkan warna warni masing masing saham?
Sementara saat ini saya hanya bisa memunculkan
satu macam warna yang sama untuk semua saham
pada masing masing sektornya. Tks.
terima kasih
sudah bisa fungsional chart rrg nya
sy lihat di chart rrg lain, titik tengah nya bs dinamis ya…
tidak selalu di tengah, itu bgmn ya logika nya ?
halo t3nsai
intinya, gunakan nilai rs dan rm yang paling ekstrem (nilai rs paling kiri dan paling kanan, nilai rm paling bawah dan paling atas) dari semua nilai rs/rm yg mau di plot untuk dijadikan acuan dalam membuat skala agar semua titik bisa di plot ke xychart sesuai proporsinya.
kok saya explore di ambi broker tampirannya tidak sama seperti di contohnya ya?
@newbie123
Base pakai IHSG tdk bisa, pakai ^JKSE juga tidak bisa. kalau pakai ^JKLQ45, ^JKKOMPAS100,^JKIDX30 bisa, tp tentunya tidak valid untuk saham diluar index2 tsb. gimana ya solusinya?
Thanks
@newbie123
Base pakai IHSG tdk bisa, pakai ^JKSE juga tidak bisa. kalau pakai ^JKLQ45, ^JKKOMPAS100,^JKIDX30 bisa, tp tentunya tidak valid untuk saham diluar index2 tsb. gimana ya solusinya?
Thanks
tyt