Fishnet Rainbow Chart for Amibroker (AFL)
mkeitel about 16 years ago Amibroker (AFL)
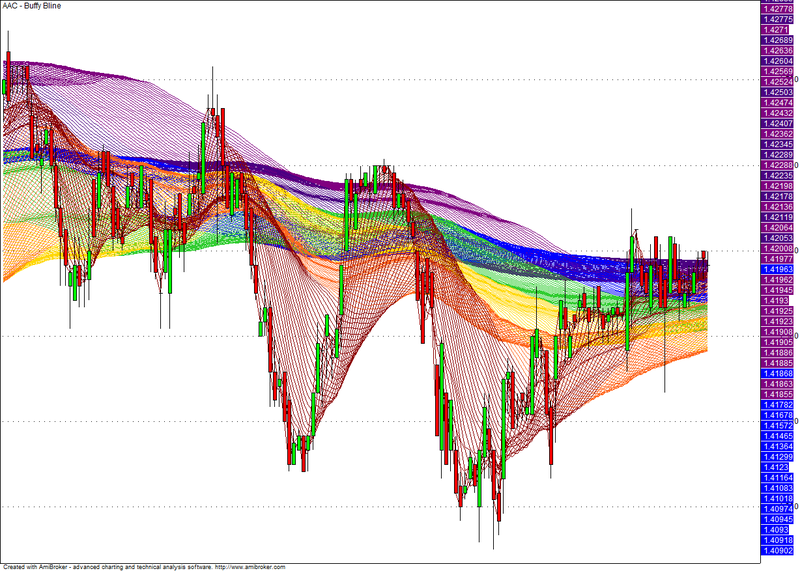
Fishnet rainbow chart. Basically plots heaps of different moving averages that produces a result that looks like a rainbow chart.
Screenshots
Indicator / Formula
Copy & Paste Friendly
/* This code plot fishnet with rainbow colors. I use 30 MA per color.

*/


_SECTION_BEGIN("");
Plot( C, "Close", ParamColor("Color", colorBlack ), styleNoTitle | ParamStyle("Style", styleCandle, maskPrice ) );

net= 30; // This value can be changed. It`s how many MA:s every color have.


for (i=1; i<net;i++) {

Plot(MA(Close,i),"",colorDarkRed,styleLine);

}

for (i=net; i<2*net;i++) {

Plot(MA(Close,i),"",colorOrange,styleLine);

}

for (i=2*net; i<3*net;i++) {

Plot(MA(Close,i),"",colorGold,styleLine);

}

for (i=3*net; i<4*net;i++) {

Plot(MA(Close,i),"",colorLime,styleLine);

}

for (i=4*net; i<5*net;i++) {

Plot(MA(Close,i),"",colorBlue,styleLine);

}

for (i=5*net; i<6*net;i++) {

Plot(MA(Close,i),"",colorIndigo,styleLine);

}

for (i=6*net; i<7*net;i++) {

Plot(MA(Close,i),"",colorViolet,styleLine);

}


_SECTION_END();
1 comments
Leave Comment
Please login here to leave a comment.
good indicator