RS Line for Amibroker (AFL)
prasadbrao over 3 years ago Amibroker (AFL)
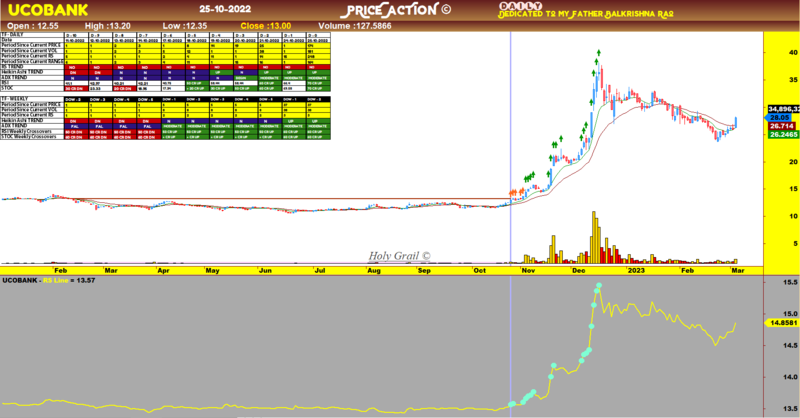
RS line is an outstanding indicator which depicts whether a particular stock is overperforming or underperforming the index. This helps in taking decision to buy or sell in combination with other indicators.
Screenshots
Files
Indicator / Formula
Copy & Paste Friendly
// Calculcate the RSL
RSL  = C/Foreign("NSENIFTY", "C");

// bias the RSL to appear below your chart without screwing it up (you may need to adjust the 2.25 value to your tsate)
rslb = RSL*1500 + LastValue(C)/2.25;

// plot the RSL on the chart
Plot(rslb, "RS Line", colorYellow, styleLine|styleThick);

// find the last highest value in the last three months
H_HHV = HHV(H,69);

// find the number of bars since this high occurred
BaseHigh = BarsSince(H == H_HHV);

// find the high of the RSL within the consolidation
RS_HHV = HHV(RSL, 69);

// check if a new RSL new high occurs
RSNH = RSL > Ref(RS_HHV, -1);

// determine if the RSL new high is within a decently long consolidation (I chose four weeks)
RSNH_inbase = RSNH AND BaseHigh > 20;

// plot the dots for regular RSL new highs and those within consolidation with different colours
PlotShapes(IIf(RSNH, shapeCircle, shapeNone), colorAqua, 0, rslb, 0);
PlotShapes(IIf(RSNH_inbase, shapeCircle, shapeNone), colorOrange, 0, rslb, 0);
5 comments
Leave Comment
Please login here to leave a comment.
Great
Great post. Thanks
great idea
this type of people we need to beat the market
he always post for advertise to show his product by unwanted few lines
not working. not shown any line or indicator. plz resolve this