EMA System Ribbon for Amibroker (AFL)
yo123 over 15 years ago Amibroker (AFL)
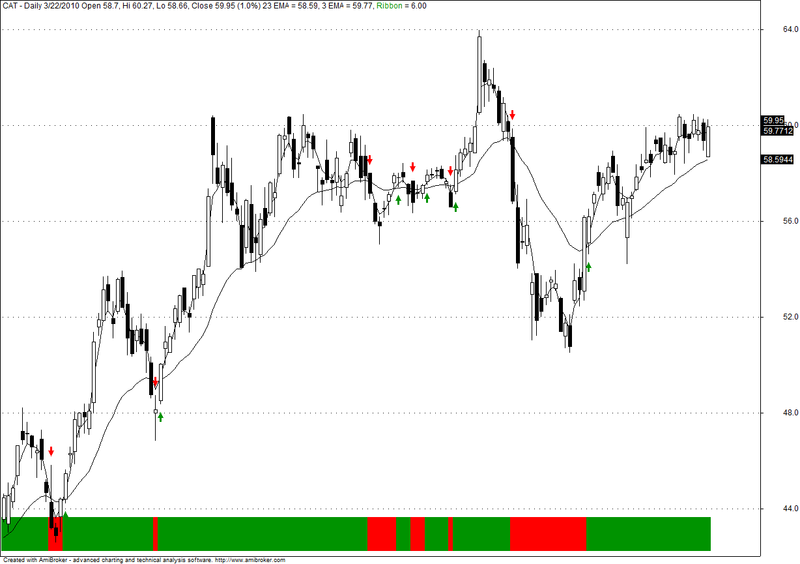
This is a simple program to demonstrate that how to visualize your strategy using Amibroker Ribbon function. The purpose is to visualise how long a buy or sell signal holds.
Steps Involved in Building the code
1)Plot the EMA3/EMA23
2)Buy or Sell Condtion i.e Buy = 3EMA>21EMA and Sell=3EMA<21EMA
3)Plot Arrows on the chart Green Arrow = Buy Signal and Red Arrow = Sell signal
4)Plot the Ribbon. Green Ribbon indicates the length of the Buy signal and Red indicates the sell signal
Now combining everything in one single AFL code
Screenshots
Indicator / Formula
Copy & Paste Friendly
_SECTION_BEGIN("Price");
SetChartOptions(0,chartShowArrows|chartShowDates);
_N(Title = StrFormat("{{NAME}} - {{INTERVAL}} {{DATE}} Open %g, Hi %g, Lo %g, Close %g (%.1f%%) {{VALUES}}", O, H, L, C, SelectedValue( ROC( C, 1 ) ) ));
Plot( C, "Close", ParamColor("Color", colorBlack ), styleNoTitle | ParamStyle("Style") | GetPriceStyle() );

/*Buy or Sell Condition*/
Buy = Cross(EMA( Close , 3 ),EMA( Close , 23 ));
Sell = Cross(EMA( Close , 23 ),EMA( Close , 3 ));

/*Pot Buy or Sell Arrows*/
PlotShapes(IIf(Sell==1, shapeDownArrow, shapeNone), colorRed, 0,High, Offset=-20);
PlotShapes(IIf(Buy==1, shapeUpArrow , shapeNone), colorGreen, 0,Low, Offset=-20);

/*Plot EMA*/
Plot( EMA( Close,23), "23 EMA",ParamColor("Color", colorRed ),styleNoRescale);
Plot( EMA( Close,3), "3 EMA",ParamColor("Color", colorBlue ),styleNoRescale);

/*Plot Ribbon */
Ribbon1=IIf( EMA( Close , 3 )>EMA( Close , 23 ) ,colorGreen, IIf(EMA( Close , 23 )>EMA( Close , 3 ), colorRed,colorYellow));
Plot(6, "Ribbon", Ribbon1, styleOwnScale| styleArea| styleNoLabel,-0.5,100);
_SECTION_END();
2 comments
Leave Comment
Please login here to leave a comment.
Does not add any value really.
Try for 8-34 EMA FOR MORE GOOD RESULTS