Kase Peak Osc. V2 batu for Amibroker (AFL)
batu1453 about 12 years ago Amibroker (AFL)
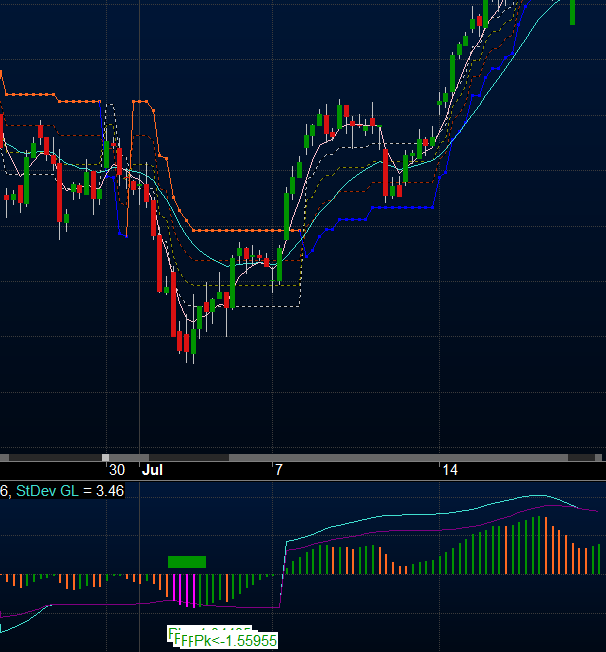
This is modified but near to original formula of Kase PO
Screenshots
Indicator / Formula
Copy & Paste Friendly
_SECTION_BEGIN("Kase Peak Osc Orginal V2.batu");
Per1=Param("Max Length",55,2,200,1);
Per2=Param("Min Length",13,2,200,1);
RWH=RWIHi(Per2,Per1);
RWL=RWILo(Per2,Per1);
Pk=WMA((RWH-RWL),3);
MN=MA(Pk,Per1);
SD=StDev(Pk,Per1);
Val1=Max(MN+(2*SD),2.2*SD);
Val2=Min(MN-(2*SD),-2.2*SD);
Val3=Max(MN+(2*SD),3*SD);
Val4=Min(MN-(2*SD),-3*SD);
LN1=IIf(PK>=0,Val1,Val2);
LN2=IIf(PK>=0,Val3,Val4);
Red=IIf(Ref(Pk,-1)>Pk,Pk,0);
Green=IIf(Pk>Ref(Pk,-1),Pk,0);


WriteIf( Val2>=Pk, "Buraya yazabilirsin", "Buraya yazılıyor" );


Buy= IIf(Pk<Val2,Val2>=Pk-0.01,Val2>=Pk);
Sell= IIf(Pk>Val1,Pk+0.01>=Val1,Pk>=Val1);

for( i = 0; i < BarCount; i++ )
 {
if( Buy[i] ) PlotText( "Pk<" + Val2[ i ], i, Pk[ i ]-2, colorGreen,colorWhite);
if( Sell[i] ) PlotText( "Pk>" + Val1[ i ], i, Pk[ i ]+2, colorRed,colorWhite);
  }

PlotShapes( Buy *18,IIf( Buy, colorGreen, colorRed ),0,0);
PlotShapes(Sell * 17, IIf( Buy, colorGreen, colorRed ),0,0);


Buy= IIf(Pk<Val4,Val4>=Pk-0.01,Val4>=Pk);
Sell= IIf(Pk>Val3,Pk+0.01>=Val3,Pk>=Val3);
Plot(Red,"Red min "+per2+"-max "+per1,IIf(Buy,11,colorOrange),styleHistogram|styleThick,Null,Null,0,1);
Plot(Green,"Green min"+per2+"-max "+per1,IIf(Sell,11,colorGreen),styleHistogram|styleThick,Null,Null,0,1);
Plot(LN1,"StDev Loc",colorViolet,styleLine);
Plot(ln2,"StDev GL",colorTurquoise,styleLine);
_SECTION_END();
0 comments
Leave Comment
Please login here to leave a comment.