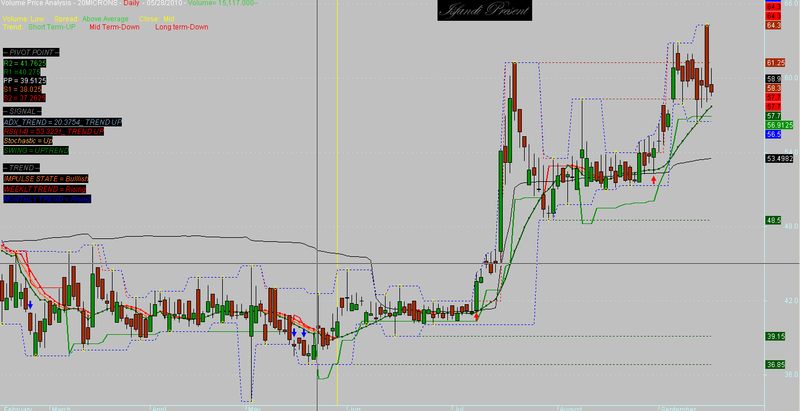
Trading System by ISFANDI for Amibroker (AFL)
sajid almost 16 years ago Amibroker (AFL)
Indonesian AFL by ISFANDI
Screenshots
Indicator / Formula
Copy & Paste Friendly
//Isfandi Present for Amibroker Community 2010
_SECTION_BEGIN("Sup / Res Lines");
SRswitch = ParamToggle("Sup / Res Lines","On,Off");
CHLswitch = ParamToggle("Hi Low / Close","Hi Low,Close");
NoLines = Param("No of Lines",3,1,10,1);
Sen = Param("Sensitivity",5,1,100,1);
Rcolor=ParamColor( "Res Color", colorDarkGreen );
Rstyle=ParamStyle( "Res Style", styleLine );
Scolor=ParamColor( "Sup Color", colorBrown );
Sstyle=ParamStyle( "Sup Style", styleLine );
y=0;
x=0;
for( i = 1; i < NoLines+1 ; i++ )
{
Y[i]=LastValue(Peak(IIf(CHLswitch,C,H),Sen,i));
x[i]=BarCount - 1 - LastValue(PeakBars(IIf(CHLswitch,C,H),Sen,i));
Line = LineArray( x[i], y[i], Null, y[i], 1 );
Plot( IIf(SRswitch,Null,Line), "", Rcolor, Rstyle );
Y[i]=LastValue(Trough(IIf(CHLswitch,C,L),Sen,i));
x[i]=BarCount - 1 - LastValue(TroughBars(IIf(CHLswitch,C,L),Sen,i));
Line = LineArray( x[i], y[i], Null, y[i], 1 );
Plot( IIf(SRswitch,Null,Line), "", Scolor, Sstyle );
}
_SECTION_END();

_SECTION_BEGIN("Detecting double tops and bottoms");
/* Detecting double tops and bottoms*/
percdiff = 5; /* peak detection threshold */
fwdcheck = 5; /* forward validity check */
mindistance = 10;
validdiff = percdiff/400;
PK= Peak( H, percdiff, 1 ) == High;
TR= Trough( L, percdiff, 1 ) == Low;
x = Cum( 1 );
XPK1 = ValueWhen( PK, x, 1 );
XPK2 = ValueWhen( PK, x, 2 );
xTR1 = ValueWhen( Tr, x, 1 );
xTr2 = ValueWhen( Tr, x, 2 );
peakdiff = ValueWhen( PK, H, 1 )/ValueWhen( PK, H, 2 );
Troughdiff=ValueWhen( tr, L, 1 )/ValueWhen( tr, L, 2 );
doubletop = PK AND abs( peakdiff - 1 ) < validdiff AND (Xpk1 -Xpk2)>mindistance AND High > HHV( Ref( H, fwdcheck ), fwdcheck - 1 );
doubleBot=tr AND abs( troughdiff - 1 ) < validdiff AND (Xtr1 -Xtr2)>mindistance AND Low < LLV( Ref( L, fwdcheck ), fwdcheck - 1 );
Buy = doubletop;
Sell = doublebot;
for( i = 0; i < BarCount; i++ )
{
if( Buy[i] ) PlotText( "Double TOP " , i, L[ i ], colorYellow );
if( Sell[i] ) PlotText( "Double BOT" , i, H[ i ], colorWhite );
}
WriteIf( Highest( doubletop ) == 1, "AmiBroker has detected some possible
double top patterns for " + Name() + "\nLook for green arrows on the price
chart.", "There are no double top patterns for " + Name() );
WriteIf(Highest( doublebot)==1,"AmiBroker has detected some possible double
bottom patterns for " + Name() + "\nLook for red arrows on the price
chart.", "There are no double bottom patterns for " + Name() );
_SECTION_END();

_SECTION_BEGIN("Isfandi Technical Viewer");
//Plot(C,"",ParamColor( "Color", colorBlue ),ParamStyle("Style") );
//---- pivot points
GfxSetBkColor(colorBlack);
GfxSetTextColor( colorGrey50 );
GfxSelectFont("Edwardian Script ITC", 25, 500, True );
GfxTextOut("Isfandi Present  ", 760 , 0 );
DayH = TimeFrameGetPrice("H", inDaily, -1);// yesterdays high
DayL = TimeFrameGetPrice("L", inDaily, -1);//low
DayC = TimeFrameGetPrice("C", inDaily, -1);//close
DayO = TimeFrameGetPrice("O", inDaily);// current day open
HiDay = TimeFrameGetPrice("H", inDaily);
LoDay = TimeFrameGetPrice("L", inDaily);
PP = (DayH + DayL + DayO + DayO) / 4 ;
R1 = (2 * PP) - DayL;
S1 = (2 * PP) - DayH;
R2 = PP + R1 - S1;
S2 = PP + S1 - R1;
R3 = R2 + (R1 - PP);
S3 = S2 - (PP - S1);
// OTHER INDICATOR
MOMETUM =RSI(14);
radius = 0.1 * Status("pxheight"); // get pixel height of the chart and use 45% for pie chart radius
textoffset = 0.1 * radius;
GfxSelectFont("Arial", 9, 500, True );
GfxSetTextColor( colorGrey50 );
GfxTextOut("-- PIVOT POINT --", textoffset , 86 );
GfxSetTextColor( colorGrey50 );
GfxTextOut("-- SIGNAL --", textoffset , 188 );
GfxSetTextColor( colorGrey50);
GfxTextOut( "-- TREND --", textoffset ,286 );
GfxSelectFont("Arial", 9 );
GfxSetTextColor( colorGreen);
GfxTextOut( "R1 =" + R1, textoffset + 1, 120 );
GfxSetTextColor( colorLime );
GfxTextOut( "R2 = " +R2, textoffset + 1, 105 );
GfxSetTextColor( colorWhite );
GfxTextOut( "PP = " +PP, textoffset + 1, 135 );
GfxSetTextColor( colorOrange );
GfxTextOut( "S1 = " +S1, textoffset + 1, 150 );
GfxSetTextColor( colorRed );
GfxTextOut( "S2 = " +S2, textoffset + 1, 165 );
GfxSelectFont("Arial", 9 );
_SECTION_END();
//////////////////////////////////////////////////////////////////////
_SECTION_BEGIN("Elder Impulse");
GfxSelectFont("Arial", 9, 500, True );
///////////////////////////////////////////////////
SetChartOptions(0,chartShowArrows|chartShowDates);
EnableTextOutput(False);
// User-defined parameter for EMA periods
EMA_Type = Param("EMA-1, TEMA-2, JMA-3", 2, 1, 3, 1);
EMA_prds = Param("EMA_periods", 7, 1, 30, 1);
Std_MACD = Param("Standard MACD? No-0, Yes-1", 1, 0, 1, 1);
Plot_fashion = Param("Bar+Arrows-1, Impulse Bars-2", 2, 1, 2, 1);
// Allow user to define Weekly and Monthly Ribbon Location and Height
WR_P1 = Param("Weekly Ribbon Location", 5.2, -1000, 1000, 0.1);
WR_P2 = Param("Weekly Ribbon Height", 199, -0.001, 500, 0.1);
//MR_P1 = Param("Monthly Ribbon Location", 5.2, -1000, 1000, 0.1);
//MR_P2 = Param("Monthly Ribbon Height", 199, -0.001, 500, 0.1);
// Compute EMA and MACD Histogram
if(EMA_Type == 1)
{
DayEMA = EMA(Close, EMA_prds);
}
if (EMA_Type == 2)
{
DayEMA = TEMA(Close, EMA_prds);
}
Histogram = MACD() - Signal();
// Determine if we have an Impulse UP, DOWN or None
Impulse_Up = DayEMA > Ref(DayEMA, -1) AND Histogram > Ref(Histogram, -1);
Impulse_Down = DayEMA < Ref(DayEMA, -1) AND Histogram < Ref(Histogram, -1);
Impulse_None = (NOT Impulse_UP) AND (NOT Impulse_Down);
// Compute Weekly MACD and determine whether rising or falling
TimeFrameSet(inWeekly);
if (Std_MACD == 0)
{
MACD_val = MACD(5, Cool);
Signal_val = Signal(5, 8, 5);
}
else
{
MACD_val = MACD(12, 26);
Signal_val = Signal(12, 26, 9);
}
Hist_in_w = MACD_val - Signal_val;
wh_rising = Hist_in_w > Ref(Hist_in_w, -1);
wh_falling = Hist_in_w < Ref(Hist_in_w, -1);
wh_none = (NOT wh_rising) AND (NOT wh_falling);
TimeFrameRestore();
// Now get Monthly MACD Histogram....
TimeFrameSet(inMonthly);
MACD_val = MACD(5, 8);
Signal_val = Signal(5, 8, 5);
Hist_in_m = MACD_val - Signal_val;
mh_rising = Hist_in_m > Ref(Hist_in_m, -1);
mh_falling = Hist_in_m < Ref(Hist_in_m, -1);
TimeFrameRestore();
wh_rising = TimeFrameExpand( wh_rising, inWeekly, expandLast );
wh_falling = TimeFrameExpand( wh_falling, inWeekly, expandLast);
wh_none = TimeFrameExpand( wh_none, inWeekly, expandLast);
mh_rising = TimeFrameExpand(mh_rising, inMonthly, expandLast);
mh_falling = TimeFrameExpand(mh_falling, inMonthly, expandLast);
kol = IIf( wh_rising, colorBrightGreen, IIf(wh_falling, colorRed, IIf(wh_none, colorCustom11, colorLightGrey)));
mkol = IIf( mh_rising, colorBlue, IIf(mh_falling, colorYellow, colorLightGrey));
if (Plot_fashion == 1)
{
}
else
{
bar_kol = IIf(impulse_UP, colorBrightGreen, IIf(impulse_Down, colorRed, colorCustom11));
}
Impulse_State = WriteIf(Impulse_Up, "Bulllish", WriteIf(Impulse_Down, "Bearish", "Neutral"));
GfxSetTextColor( colorOrange );
GfxTextOut( "IMPULSE STATE = " +Impulse_State, textoffset + 1, 305 );
// Set the background color for Impulse Status Column
Impulse_Col = IIf(Impulse_Up, colorGreen, IIf(Impulse_Down, colorRed, colorGrey40));
// Determine Weekly Trend. Display as Text Column
Weekly_Trend = WriteIf(wh_rising, "Rising", WriteIf(wh_falling, "Falling", "Flat!"));
Weekly_Col = IIf(wh_rising, colorGreen, IIf(wh_falling, colorRed, colorLightGrey));
GfxSetTextColor( colorRed );
GfxTextOut( "WEEKLT TREND = " +Weekly_Trend, textoffset + 1, 323 );
// Determine Monthly Trend. Display as Text Column
Monthly_Trend = WriteIf(mh_rising, "Rising", WriteIf(mh_falling, "Falling", "Flat!"));
Monthly_Col = IIf(mh_rising, colorGreen, IIf(mh_falling, colorRed, colorLightGrey));
GfxSetTextColor( colorBlue );
GfxTextOut( "MONTHLY TREND = " +Monthly_Trend, textoffset + 1, 340 );
// Determine how many bars has the current state existed
bars_in_bull = Min(BarsSince(impulse_none), BarsSince(impulse_down));
bars_in_bear = Min(BarsSince(impulse_up), BarsSince(impulse_none));
bars_in_neut = Min(BarsSince(impulse_down), BarsSince(impulse_up));
// Set a single variable to show number of bars in current state depending upon
// actual Impulse Status - Bullish, Bearish or Neutral
bars_in_state = IIf(Impulse_Up, bars_in_bull, IIf(Impulse_down, bars_in_bear, bars_in_neut));
//weekly pivot
k1=-1;
SetChartBkColor(16 ) ;
k=IIf(ParamList("select type","daily|next day")=="daily",-1,0);
k1=-1;
TimeFrameSet(inDaily);
day_h= LastValue(Ref(H,K));
day_l= LastValue(Ref(L,K));
day_c= LastValue(Ref(C,K));
TimeFrameRestore();
// day
DH=Day_h;
DL=Day_L;
DC=Day_C;
// DAY PIVOT Calculation
pd = ( DH+ DL + DC )/3;
sd1 = (2*pd)-DH;
sd2 = pd -(DH - DL);
sd3 = Sd1 - (DH-DL);
rd1 = (2*pd)-DL;
rd2 = pd +(DH -DL);
rd3 = rd1 +(DH-DL);
WriteVal( StochK(39) - StochK(12) );
GfxSelectFont("Arial", 8 );
_SECTION_END();
_SECTION_BEGIN("STOCHASTIC");
GfxSelectFont("Arial", 9, 500, True );
periods = Param( "Periods", 15, 1, 200, 1 );
Ksmooth = Param( "%K avg", 3, 1, 200, 1 );
a = StochK( periods , Ksmooth);
Dsmooth = Param( "%D avg", 3, 1, 200, 1 );
b = StochD( periods , Ksmooth, DSmooth );
Buy = Cross( a, b );
Sell = Cross( b, a );
STOCH =WriteIf(a>b , "Up","Down");
GfxSetTextColor( colorLightOrange );
GfxTextOut( "Stochastic = " +STOCH, textoffset + 1, 239 );
GfxSelectFont("Arial", 8 );
_SECTION_BEGIN("Van K Tharp Efficient Stocks");
// Mark Keitel 12-05
// Van K Tharp Efficient Stocks
GfxSelectFont("Arial", 9, 500, True );
ATRD180 = ATR(180);
ATRD90 = ATR(90);
ATRD45 = ATR(45);
ATRD20 = ATR(20);
ATRD5 = ATR(5);
DifferenceD180 = Close - Ref(Close,-180);
DifferenceD90 = Close - Ref(Close,-90);
DifferenceD45 = Close - Ref(Close,-45);
DifferenceD20 = Close - Ref(Close,-20);
DifferenceD5 = Close - Ref(Close,-5);
EfficiencyD180 = IIf(ATRD180!=0,DifferenceD180/ATRD180,1);
EfficiencyD90 = IIf(ATRD90!=0,DifferenceD90/ATRD90,1);
EfficiencyD45 = IIf(ATRD45!=0,DifferenceD45/ATRD45,1);
EfficiencyD20 = IIf(ATRD20!=0,DifferenceD20/ATRD20,1);
EfficiencyD5 = IIf(ATRD5!=0,DifferenceD5/ATRD5,1);
Averageeff = (EfficiencyD180 + EfficiencyD90 + EfficiencyD45 +
EfficiencyD20 ) / 4;
//Plot( averageeff, "AvgEff", colorLightBlue, styleLine );
x = Param ( "Add Results to a Watchlist? Yes = 1, No = 2" , 2 , 1 , 2 , 1 ) ;  // select whether to add results to watchlist or not
y = Param("Set Watchlist Number", 25, 2, 60,1);    // sets the watchlist number, but reserves the first 2 and last 4 watchlists
//  --------  Parameter Variables for Exploration  --------------------------------
TCH = Param("High close value ", 20, 5, 300, 0.5);
TCL  = Param("Low close value " , 5, 1, 10, 0.25);
AVP = Param("Period for Avg Vol " , 21, 10, 240, 1);
SV = Param("Stock minimum Avg Vol " , 125000, 50000, 1000000, 500000);
//  --------------  Organize the exploration results ------------------------------------
P = Param("Period for Price Delta Comparisons", 1, 1, 120, 1);
P1 = Param("Period for Other Delta Comparisons", 3, 1, 120, 1);
PATR = Param("Period for ATR", 5,1,21,1);
PADX = Param("Period for ADX", 14, 3, 34,1);
PRSI = Param("Period for RSI", 13, 3, 34,1);
ADX_TREND =WriteIf(PDI(PADX)>MDI(PADX),"_ TREND UP","_TREND DOWN");
GfxSetTextColor( colorRed );
GfxTextOut( "RSI(14) = " + MOMETUM +  ADX_TREND , textoffset + 1,223);
ADX_14 = ADX(14);
GfxSetTextColor( colorLightBlue );
GfxTextOut( "ADX_TREND = " +ADX_14+ ADX_TREND, textoffset + 1, 207 );
_SECTION_END();
_SECTION_BEGIN("SmoothHeikin MA Swing");
SetBarsRequired(200,0);
GraphXSpace = 1;
SetChartOptions(0,chartShowArrows|chartShowDates);
k = Param("K", 1.5, 1, 5, 0.1);
Per = Param("ATR", 3, 1, 30, 0.50);
k1 = Optimize("K", 1, 0.1, 5, 0.1);
Per1 = Optimize("ATR", 3, 1, 30, 0.50);
HACLOSE=(O+H+L+C)/4;
HaOpen = AMA( Ref( HaClose,  -1 ),  0.5 );
HaHigh = Max( H,  Max( HaClose,  HaOpen ) );
HaLow = Min( L,  Min( HaClose,  HaOpen ) );
//PlotOHLC( HaOpen, HaHigh, HaLow, HaClose, "" + Name(), colorBlack, styleCandle | styleNoLabel );
j=Haclose;
//=======================================================================================================================
//=========================Indicator==============================================================================================
f=ATR(14);

rfsctor = WMA(H-L, Per);

revers = k * rfsctor;

Trend = 1;
NW[0] = 0;


for(i = 1; i < BarCount; i++)
{
 if(Trend[i-1] == 1)
 {
  if(j[i] < NW[i-1])
  {
   Trend[i] = -1;
   NW[i] = j[i] + Revers[i];
  }
  else
  {
   Trend[i] = 1;
   if((j[i] - Revers[i]) > NW[i-1])
   {
    NW[i] = j[i] - Revers[i];
   }
   else
   {
    NW[i] = NW[i-1];
   }
  }
 }
 if(Trend[i-1] == -1)
 {
  if(j[i] > NW[i-1])
  {
   Trend[i] = 1;
   NW[i] = j[i] - Revers[i];
  }
  else
  {
   Trend[i] = -1;
   if((j[i] + Revers[i]) < NW[i-1])
   {
    NW[i] = j[i] + Revers[i];
   }
   else
   {
    NW[i] = NW[i-1];
   }
  }
 }
}

//===============system================

Plot(NW, "", IIf(Trend == 1, 27, 4), 4);
Buy=Cover=Cross(j,nw);
Sell=Short=Cross(nw,j);
SWING =WriteIf(j > nw, "UPTREND","DOWNTREND");
GfxSetTextColor( colorGreen );
GfxTextOut( "SWING = " +SWING, textoffset + 1, 256 );
GfxSelectFont("Arial", 8 );
shape = Buy * shapeCircle + Sell * shapeCircle;
//PlotShapes( shape, IIf( Buy, colorGreen, colorOrange ), 0, IIf( Buy, Low-f, High+f));


_SECTION_END();


_SECTION_BEGIN("Intraday MA Oprekan Isfandi");
Periods = Param("Periods", 15, 2, 200, 1, 10 );
CG=MA(C,Periods);
Plot(CG, "MA",IIf(CG<=Low,ParamColor("Color_U", colorRed ),ParamColor("Color_D", colorOrange )), styleThick);
amv0=Volume*(O+C)/2;
Life_line= Sum(amv0,88)/Sum(Volume,88);
Plot( Life_line, "Life_line", ParamColor("Color", colorBlack ), ParamStyle("Style")  );
FL=HHV(CG,2);
support=HHV(CG,2);
FS=CG-(FL-CG);
Plot(support, "support_line", colorRed,styleThick);
Plot(FS, "", colorDarkGreen,styleThick);
_SECTION_END();


_SECTION_BEGIN
("BW Fractal");
CondUpFractal =

(
Ref(H,-2)<H AND Ref(H,-1)<H AND Ref(H,1)<H AND Ref(H,2)<H) OR

(
Ref(H,-3)<H AND Ref(H,-2)<H AND Ref(H,-1)==H AND Ref(H,1)<H AND Ref(H,2)<H) OR

(
Ref(H,-4)<H AND Ref(H,-3)<H AND Ref(H,-2)==H AND Ref(H,-1)==H AND Ref(H,1)<H AND Ref(H,2)<H) OR

(
Ref(H,-4)<H AND Ref(H,-3)<H AND Ref(H,-2)==H AND Ref(H,-1)==H AND Ref(H,1)<H AND Ref(H,2)<H) OR

(
Ref(H,-6)<H AND Ref(H,-5)<H AND Ref(H,-4)==H AND Ref(H,-3)<H AND Ref(H,-2)==H AND Ref(H,-1)<H AND Ref(H,1)<H AND Ref(H,2)<H);

UpFractal =
ValueWhen(CondUpFractal,H,1);

PlotShapes
(CondUpFractal*shapeHollowSmallCircle,colorYellow,Layer=0,UpFractal,Offset=0);

CondDownFractal =

(
Ref(L,-2)>L AND Ref(L,-1)>L AND Ref(L,1)>L AND Ref(L,2)>L) OR

(
Ref(L,-3)>L AND Ref(L,-2)>L AND Ref(L,-1)==L AND Ref(L,1)>L AND Ref(L,2)>L) OR

(
Ref(L,-4)>L AND Ref(L,-3)>L AND Ref(L,-2)==L AND Ref(L,-1)==L AND Ref(L,1)>L AND Ref(L,2)>L) OR

(
Ref(L,-4)>L AND Ref(L,-3)>L AND Ref(L,-2)==L AND Ref(L,-1)==L AND Ref(L,1)>L AND Ref(L,2)>L) OR

(
Ref(L,-6)>L AND Ref(L,-5)>L AND Ref(L,-4)==L AND Ref(L,-3)>L AND Ref(L,-2)==L AND Ref(L,-1)>L AND Ref(L,1)>L AND Ref(L,2)>L);

DownFractal =
ValueWhen(CondDownFractal,L,1);

PlotShapes
(CondDownFractal*shapeHollowSmallCircle,colorYellow,Layer=0,DownFractal,Offset=0);

PlotShapes
(Cross(C,UpFractal)*shapeUpArrow,colorRed,Layer=0,L);

PlotShapes
(Cross(DownFractal,C)*shapeDownArrow,colorBlue,Layer=0,H);

Plot
(Ref(UpFractal,2), "Up Fractal", ParamColor("Up Fractal Color",colorRed),
ParamStyle
("Up Fractal Style", styleDashed));
Plot
(Ref(DownFractal,2), "Down Fractal",ParamColor("Down Fractal Color",colorBlue), ParamStyle("Down Fractal Style", styleDashed));
Plot(Max(HHV(H,3),Ref(UpFractal,2)), "Up Fractal", ParamColor("Up Fractal Color",colorRed), ParamStyle("Up Fractal Style", styleDashed));
Plot(Max(HHV(H,3),Ref(UpFractal,2)), "Down Fractal",ParamColor("Down Fractal Color",colorBlue), ParamStyle("Down Fractal Style", styleDashed));
_SECTION_END
();

GraphZOrder = 1;

_SECTION_BEGIN("Chart Settings");
p_color_bkgnd = ParamColor("Background color", colorLightGrey);
// for intraday, you probably don't want log... set default to be linear
p_logscale = ParamToggle("Axis type (control with this)", "Linear|Logarithmic", 0);
p_Colorbars = ParamToggle("Price display color?", "Mono|Color", 0);
p_PriceColor = ParamColor("Price mono color", colorBlack );
p_PriceStyle = ParamStyle("Price Style", styleThick);
SetChartBkColor(p_color_bkgnd);
StaticVarSet("L_color_bkgnd", p_color_bkgnd);
L_color_mono = p_PriceColor;

// change this later
if (IsNull(StaticVarGet("L_color_bkgnd"))) {
   L_color_bkgnd = p_color_bkgnd;
} else {
   L_color_bkgnd = StaticVarGet("L_color_bkgnd");
}

// We need to know whether we are log scale or not
// so set it ourselves then change the toggle the chart for log/linear and
// use the it for trendline calculations etc.
// If we had used the log/linear parameter on the "Axis and Grid menu"
// then we have to remember to change the log/linear calculation.
SetChartOptions(0,chartShowArrows|chartShowDates);
if (p_logscale == 1) {
   SetChartOptions(2, chartLogarithmic, chartGridMiddle|chartGridMargins);
} else {
   SetChartOptions(3, chartLogarithmic, !(chartGridMiddle|chartGridMargins));
}
Visiblebars = Status("barvisible");


_N(Title = StrFormat("{{NAME}} - {{INTERVAL}} {{DATE}} Open %g, Hi %g, Lo %g, Close %g (%.1f%%)  Vol " +
   WriteVal( V, 1.0 ) +"\n{{VALUES}}",
    O, H, L, C,  SelectedValue( ROC( C, 1 )) ));


//  Start of variables used to control color of bars/indicators
BullishBar = H > Ref(H,-1) AND L > Ref(L,-1);
BearishBar = H < Ref(H,-1) AND L < Ref(L,-1);

if (p_Colorbars==1) {
   PriceColor = IIf(BullishBar,colorLime,IIf(BearishBar,colorRed,colorBlue));
} else {
   PriceColor = L_color_mono;
}
_SECTION_END();

// for pricefield and set initial scaling
Plot(C, "", PriceColor, styleNoTitle | p_PriceStyle | GetPriceStyle() );


//====================================================================================
_SECTION_BEGIN("Volume Price Analysis - V.1.2");
SetChartOptions(0,chartShowArrows|chartShowDates);
//=======================================================================================
DTL=Param("Linear regression period",60,10,100,10);
wbf=Param("WRB factor",1.5,1.3,2.5,.1);
nbf=Param("NRB factor",0.7,0.3,0.9,0.1);
TL=LinRegSlope(MA(C, DTL),2);
Vlp=Param("Volume lookback period",30,20,300,10);
Vrg=MA(V,Vlp);
St = StDev(Vrg,Vlp);
Vp3 = Vrg + 3*st;
Vp2 = Vrg + 2*st;;
Vp1 = Vrg + 1*st;;
Vn1 = Vrg -1*st;
Vn2 = Vrg -2*st;
rg=(H-L);
arg=Wilders(rg,30);
wrb=rg>(wbf*arg);
nrb=rg<(nbf*arg);
Vl=V<Ref(V,-1) AND V<Ref(V,-2);
upbar=C>Ref(C,-1);
dnbar=C<Ref(C,-1);
Vh=V>Ref(V,-1) AND Ref(V,-1)>Ref(V,-2);
Cloc=C-L;
x=rg/Cloc;
x1=IIf(Cloc==0,arg,x);
Vb=V>Vrg OR V>Ref(V,-1);
ucls=x1<2;
dcls=x1>2;
mcls=x1<2.2 AND x1>1.8 ;
Vlcls=x1>4;
Vhcls=x1<1.35;
j=MA(C,5);
TLL=LinRegSlope(j,40) ;
Tlm=LinRegSlope(j,15) ;
tls=LinRegSlope(j,5);
mp=(H+L)/2;
_SECTION_END();
//==========================================================================================
_SECTION_BEGIN("VSA");
utbar=wrb AND dcls AND tls>0 ;
utcond1=Ref(utbar,-1) AND dnbar ;
utcond2=Ref(utbar,-1) AND dnbar AND V>Ref(V,-1);
utcond3=utbar AND V> 2*Vrg;
trbar=Ref(V,-1)>Vrg  AND Ref(upbar,-1) AND Ref(wrb,-1) AND dnbar AND dcls AND wrb AND tll>0 AND H==HHV(H,10);
Hutbar=Ref(upbar,-1) AND Ref(V,-1)>1.5*Vrg AND dnbar AND dcls AND NOT wrb AND NOT utbar;
Hutcond=Ref(Hutbar,-1) AND dnbar AND dcls AND NOT utbar;
tcbar=Ref(upbar,-1) AND H==HHV(H,5)AND dnbar AND (dcls OR mcls) AND V>vrg AND NOT wrb AND NOT Hutbar ;
Scond1=(utcond1 OR utcond2 OR utcond3) ;
Scond2=Ref(scond1,-1)==0;
scond=scond1 AND scond2;
stdn0= tll<0 AND V>Ref(V,-1) AND Ref(dnbar,-1) AND upbar AND (ucls OR mcls) AND tls<0 AND tlm<0;
stdn= V>Ref(V,-1) AND Ref(dnbar,-1) AND upbar AND (ucls OR mcls) AND tls<0 AND tlm<0;
stdn1= tll<0 AND V>(vrg*1.5) AND Ref(dnbar,-1) AND upbar AND (ucls OR mcls)AND tls<0 AND tlm<0;
stdn2=tls<0 AND Ref(V,-1)<Vrg  AND upbar AND vhcls AND V>Vrg;
bycond1= stdn OR stdn1;
bycond= upbar  AND Ref(bycond1,-1);
stvol= L==LLV(L,5)  AND (ucls OR mcls) AND V>1.5*Vrg AND tll<0;
ndbar=upbar AND nrb AND Vl  AND dcls ;
nsbar=dnbar AND nrb AND Vl  AND dcls ;
nbbar= C>Ref(C,-1) AND Vl AND nrb AND x1<2;
nbbar= IIf(C>Ref(C,-1) AND V<Ref(V,-1) AND V<Ref(V,-2) AND x1<1.1,1,0);
lvtbar= vl AND L<Ref(L,-1) AND ucls;
lvtbar1= V<Vrg AND L<Ref(L,-1) AND ucls AND tll>0 AND tlm>0 AND wrb;
lvtbar2= Ref(Lvtbar,-1) AND upbar AND ucls;
dbar= V>2*Vrg AND dcls AND upbar AND tls>0 AND tlm>0 AND NOT Scond1 AND NOT utbar;
eftup=H>Ref(H,-1) AND L>Ref(L,-1) AND C>Ref(C,-1) AND C>=((H-L)*0.7+L) AND rg>arg AND V>Ref(V,-1);
eftupfl=Ref(eftup,-1) AND (utbar OR utcond1 OR utcond2 OR utcond3);
eftdn=H<Ref(H,-1) AND L<Ref(L,-1) AND C<Ref(C,-1) AND  C<=((H-L)*0.25+L) AND rg>arg AND V>Ref(V,-1);
_SECTION_END();

_SECTION_BEGIN("Commentary");
Vpc= utbar OR utcond1 OR utcond2 OR utcond3 OR stdn0 OR stdn1 OR stdn2 OR stdn OR lvtbar1 OR Lvtbar OR Lvtbar2 OR Hutbar OR Hutcond OR ndbar OR stvol OR tcbar;
if( Status("action") == actionCommentary )
(
printf ( "=========================" +"\n"));
printf ( "VOLUME PRICE ANALYSIS" +"\n");
printf ( "" +"\n");
printf ( "=========================" +"\n");
printf ( Name() + " - " +Interval(2) +  "  - " + Date() +" - " +"\n"+"High-"+H+"\n"+"Low-"+L+"\n"+"Open-"+O+"\n"+
"Close-"+C+"\n"+ "Volume= "+ WriteVal(V)+"\n");
WriteIf(Vpc,"=======================","");
WriteIf(Vpc,"VOLUME ANALYSIS COMMENTARY:\n","");
WriteIf(utbar , "Up-thrusts are designed to catch stops and to mislead as many traders as possible.
They are normally seen after there has been weakness in the background. The market makers know that the
market is weak, so the price is marked up to catch stops, encourage traders to go long in a weak market,
AND panic traders that are already Short into covering their very good position.","")+
WriteIf(utcond3,"This upthrust bar is at high volume.This is a sure sign of weakness. One may even seriously
consider ending the Longs AND be ready to reverse","")+WriteIf(utbar OR utcond3," Also note that A wide spread
down-bar that appears immediately after any up-thrust, tends to confirm the weakness (the market makers are
locking in traders into poor positions).
With the appearance of an upthrust you should
certainly be paying attention to your trade AND your stops. On many upthrusts you will find that the market will
'test' almost immediately.","")+WriteIf(utcond1 , "A wide spread down bar following a Upthrust Bar.
This confirms weakness. The Smart Money is locking in Traders into poor positions","");
WriteIf(utcond2 , "Also here the volume is high( Above Average).This is a sure sign of weakness. The Smart Money is
locking in Traders into poor positions","")+WriteIf(stdn, "Strength Bar. The stock has been in a down Trend. An upbar
with higher Volume closing near the High is a sign of strength returning. The downtrend is likely to reverse soon. ","")+
WriteIf(stdn1,"Here the volume is very much above average. This makes this indication more stronger. ","")+
WriteIf(bycond,"The previous bar saw strength coming back. This upbar confirms strength. ","")+
WriteIf(Hutbar," A pseudo Upthrust. This normally appears after an Up Bar with above average volume. This looks like an upthrust bar
closing down near the Low. But the Volume is normally Lower than average. this is a sign of weakness.If the Volume is High then weakness
increases. Smart Money is trying to trap the retailers into bad position. ","")+
WriteIf(Hutcond, "A downbar after a pseudo Upthrust Confirms weakness. If the volume is above average the weakness is increased. ","")+
WriteIf(Lvtbar2,"The previous bar was a successful Test of supply. The current bar is a upbar with higher volume. This confirms strength","")+
WriteIf(dbar,"A wide range, high volume bar in a up trend closing down is an indication the Distribution is in progress. The smart money
is Selling the stock to the late Comers rushing to Buy the stock NOT to be Left Out Of a Bullish move. ","")+
WriteIf(Lvtbar2,"The previous bar was a successful Test of supply. The current bar is a upbar with higher volume. This confirms strength","")+
WriteIf(tcbar,"The stock has been moving up on high volume. The current bar is a Downbar with high volume. Indicates weakness and probably end of the up move","")+
WriteIf(eftup,"Effort to Rise bar. This normally found in the beginning of a Markup Phase and is bullish sign.These may be found at the top of an Upmove as the Smart money makes a
last effort to move the price to the maximum","")+
WriteIf(eftdn,"Effort to Fall bar. This normally found in the beginning of a Markdown phase.","")+
WriteIf(nsbar,"No Supply. A no supply bar indicates supply has been removed and the Smart money can markup the price. It is better to wait for confirmation","")+
WriteIf(stvol,"Stopping Volume. This will be an downbar during a bearish period closing towards the Top accompanied by High volume.
A stopping Volume normally indicates that smart money is absorbing the supply which is a Indication that they are Bullishon the MArket.
Hence we Can expect a reversal in the down trend. ","")+
WriteIf(ndbar, "No Demand
Brief Description:
Any up bar which closes in the middle OR Low, especially if the Volume has fallen off,
is a potential sign of weakness.
Things to Look Out for:
if the market is still strong, you will normally see signs of strength in the next few bars,
which will most probably show itself as a:
* Down bar with a narrow spread, closing in the middle OR High.
* Down bar on Low Volume.","");
_SECTION_END();

//======================================================================================================================================================================================
//TITLE
_SECTION_BEGIN("Title");
if( Status("action") == actionIndicator )
(
Title = EncodeColor(colorWhite)+ "Volume Price Analysis" + " - " +  Name() + " - " + EncodeColor(colorRed)+ Interval(2) + EncodeColor(colorWhite) +
 "  - " + Date() +" - " +EncodeColor(colorLime)+ "Volume= "+WriteVal(V)+"--"+EncodeColor(colorYellow)+"\n"+
WriteIf (utbar, " An Upthrust Bar. A sign of weakness. ","")+
WriteIf (utcond1, " A downbar after an Upthrust. Confirm weakness. ","")+
WriteIf (utcond2 AND NOT utcond1, " A High Volume downbar after an Upthrust. Confirm weakness.","")+
WriteIf (utcond3, "This upthrust at very High Voume, Confirms weakness","")+
WriteIf (stdn1, "Strength seen returning after a down trend. High volume adds to strength. ","")+
WriteIf (stdn0 AND NOT stdn, "Strength seen returning after a down trend. ","")+
WriteIf (stdn AND NOT stdn1, "Strength seen returning after a long down trend. ","")+
WriteIf (Lvtbar, "Test for supply. ","")+
WriteIf (Lvtbar2, "An Upbar closing near High after a Test confirms strength. ","")+
WriteIf (bycond, "An Upbar closing near High. Confirms return of Strength. ","")+
WriteIf (dbar, "A High Volume Up Bar closing down in a uptrend shows Distribution. ","")+
WriteIf (Hutbar, "Psuedo UpThrust.   A Sign of Weakness. ","")+
WriteIf (Hutcond, "A Down Bar closing down after a Pseudo Upthrust confirms weakness. ","")+
WriteIf (Lvtbar1, "Test for supply in a uptrend. Sign of Strength. ","")+
WriteIf (stdn2, "High volume upbar closing on the high indicates strength. ","")+
WriteIf (Tcbar, "High volume Downbar after an upmove on high volume indicates weakness. ","")+
WriteIf (ndbar, "No Demand. A sign of Weakness. ","")+
WriteIf (nsbar, "No Supply. A sign of Strength. ","")+
WriteIf (eftup, "Effort to Rise. Bullish sign ","")+
WriteIf (eftdn, "Effort to Fall. Bearish sign ","")+
WriteIf (eftupfl, "Effort to Move up has failed. Bearish sign ","")+
WriteIf (stvol, "Stopping volume. Normally indicates end of bearishness is nearing. ","")+
("\n Volume: ")+WriteIf(V>Vp2,EncodeColor(colorLime)+"Very High",WriteIf(V>Vp1,EncodeColor(colorLime)+" High",WriteIf(V>Vrg,EncodeColor(colorLime)+"Above Average",
WriteIf(V<Vrg AND V>Vn1,EncodeColor(colorRed)+"Less than Average",WriteIf(V<Vn1,"Low","")))))+
(EncodeColor(colorYellow)+"      Spread: ")+WriteIf(rg >(arg*2),EncodeColor(colorLime)+" Wide",WriteIf(rg>arg,EncodeColor(colorLime)+" Above Average",EncodeColor(colorRed)+" Narrow"))+
(EncodeColor(colorYellow)+"      Close:  ")+WriteIf(Vhcls,EncodeColor(colorLime)+"Very High",WriteIf(ucls,EncodeColor(colorLime)+"High",WriteIf(mcls,EncodeColor(colorYellow)+"Mid",
WriteIf(dcls,EncodeColor(colorRed)+"Down","Very Low"))))+
("\n Trend: ")+WriteIf(tls>0,EncodeColor(colorLime)+"  Short Term-UP",EncodeColor(colorRed)+"  Short Term-Down")+
WriteIf(tlm>0,EncodeColor(colorLime)+"         MID Term-UP",EncodeColor(colorRed)+"        Mid Term-Down")+
WriteIf(tll>0,EncodeColor(colorLime)+"       Long Term-Up",EncodeColor(colorRed)+"         Long term-Down"));
17 comments
Leave Comment
Please login here to leave a comment.
best i have ever seen in my life
it has mistake if i scan
x=0;
for( i = 1; i < NoLines+1 ; i++ )
{
Y[i]
-^Error 10.
Subscript out of range.
You must not access array elements outside 0..(BarCount-1) range.
..
Try applying to a stock that has enough data.
Want to explore more of ‘Intraday MA Oprekan Isfandi’AFL included in this.
HIs there a way to include vairable para,eter into this ,so that I can check for bigger trades.
( I am checking the yellow dots)
The best !
Search for the best AFL probably ends here !
how to resolve error
Error 10.
Subscript out of range.
You must not access array elements outside 0..(BarCount-1) range
Dear administrator !
This Indicator not working.
Please help me.
Thanks you very much.
What error are you getting?
Dear administrator !
This is mistake :
Error 31 : Systax error
Amibroker 5.7
Thank you.
Try it now.
Dear Admin
I getting error in a couple of areas in the code :
I am having Amibroker 6.2 which was biggest mistake, have problems with most of the good codes.
Request your kind help
Warm Regards
JS
They are only warnings and the code should still work.
Thank you Admin.
Strangely now my errors or different, not sure if I pasted a different code from this website.
Can I remark this portion of the code as I am not able to apply this on the chart. I see this is some MA, want to know your expert thoughts on this one.
Cheers
JS
Now I got rid of this error (just removed the integers in the lines) and now got Warning at
And when I ignore and apply to the chart all I get is a
-——————- (candlesticks appearing as dashes or hypens) right in the centre of the sheet. Wish I could attach the picture but not sure how to do it here.Please help.
Cheers
JS
Are you using the ‘Copy & Paste Friendly’ link because I tried the formula in Amibroker 6.2 and it worked fine. The two warnings were there but it worked fine.
solution..