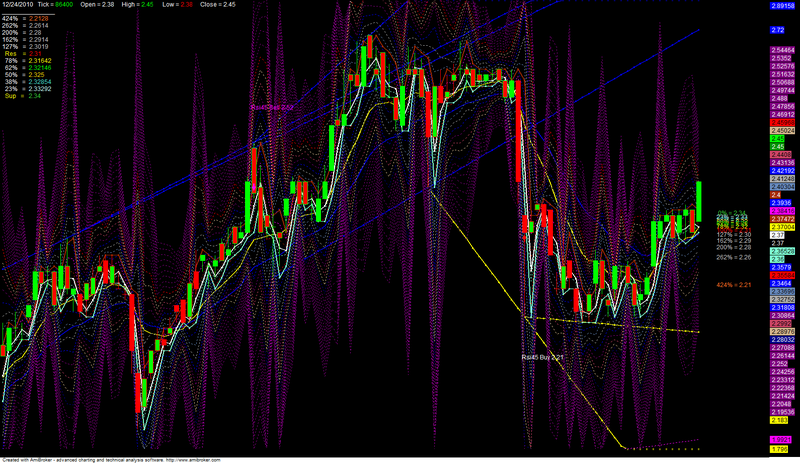
RAJASWAMY NIFTY CLINIC for Amibroker (AFL)
rajaswamy about 15 years ago Amibroker (AFL)
THIS CHART IS THE TRADERS MONEY MAKING MAGIC FORMULA FRIST YOU HAVE TO UNDERSTAND THIS AND YOU WONT FIEND LIKE THIS ANY WERE IN TRADING FORMULA TRY AND REPLY ME
Screenshots
Indicator / Formula
Copy & Paste Friendly
_SECTION_BEGIN("Name");
GfxSetOverlayMode(1);
GfxSelectFont("Tahoma", Status("pxheight")/8 );
GfxSetTextAlign( 6 );// center alignment
GfxSetTextColor( ColorHSB( 42, 42, 42 ) );
GfxSetBkMode(0); // transparent
GfxTextOut( Name(), Status("pxwidth")/2, Status("pxheight")/12 );
GfxSelectFont("Tahoma", Status("pxheight")/18 );
GfxTextOut( IndustryID(1), Status("pxwidth")/2, Status("pxheight")/4 );

GfxSelectFont("Tahoma", Status("pxheight")/18 );
GfxSelectFont("Tahoma", Status("pxheight")/36 );
GfxTextOut( "RAJASWAMY", Status("pxwidth")/2, Status("pxheight")/3 );
_SECTION_END();

_SECTION_BEGIN("Price");
SetChartOptions(0,chartShowArrows|chartShowDates);
_N(Title = StrFormat("{{NAME}} - {{INTERVAL}} {{DATE}} Open %g, Hi %g, Lo %g, Close %g (%.1f%%) {{VALUES}}", O, H, L, C, SelectedValue( ROC( C, 1 ) ) ));
rg=(H-L);
arg=Wilders(rg,30);
wrb=rg>(2.5*arg);
Cloc=C-L;
x=rg/Cloc;
x1=IIf(Cloc=0,arg,x);
dcls=x1>2;
j=MA(C,5);
tls=LinRegSlope(j,5);
utbar=wrb AND dcls AND tls>0 ;
//barcolor = IIf(utbar, colorRed, colorGreen);
//Plot( C, "Close", barcolor,styleBar );
//PlotShapes( shapeUpArrow *(utbar) , colorWhite, 0, H, 10 );
//Filter =utbar;
//AddColumn(utbar,"Trend Change",1,colorGreen,IIf(utbar,colorRed,colorGreen));

_SECTION_END();
_SECTION_BEGIN("Peak");
//Peak-Trough System + Auto ATR + Position sizing+Varible Sensitivity//
// Last Update 16 Oct 05 By Kook//

PctVlt=(ATR(14)/C)*100;//PercentVolatility

PK=IIf(PctVlt<0.5,Peak(Close,0.5,1),
IIf( PctVlt>=0.5 AND PctVlt< 1.0 ,Peak(Close,0.70,1),
IIf( PctVlt>=1.0 AND PctVlt< 1.5 ,Peak(Close,0.90,1),
IIf( PctVlt>=1.5 AND PctVlt< 2.0 ,Peak(Close,1.10,1),
IIf( PctVlt>=2.0 AND PctVlt< 2.5 ,Peak(Close,1.30,1),
IIf( PctVlt>=2.5 AND PctVlt< 3.0 ,Peak(Close,1.50,1),
IIf( PctVlt>=3.0 AND PctVlt< 3.5 ,Peak(Close,1.70,1),
IIf( PctVlt>=3.5 AND PctVlt< 4.0 ,Peak(Close,2.00,1),
Peak(Close,2.20,1) ))))))));

TGH=IIf(PctVlt<0.5,Trough(Close,0.5,1),
IIf( PctVlt>=0.5 AND PctVlt< 1.0 ,Trough(Close,0.75,1),
IIf( PctVlt>=1.0 AND PctVlt< 1.5 ,Trough(Close,1.00,1),
IIf( PctVlt>=1.5 AND PctVlt< 2.0 ,Trough(Close,1.25,1),
IIf( PctVlt>=2.0 AND PctVlt< 2.5 ,Trough(Close,1.50,1),
IIf( PctVlt>=2.5 AND PctVlt< 3.0 ,Trough(Close,1.75,1),
IIf( PctVlt>=3.0 AND PctVlt< 3.5 ,Trough(Close,2.00,1),
IIf( PctVlt>=3.5 AND PctVlt< 4.0 ,Trough(Close,2.25,1),
Trough(Close,2.50,1) ))))))));

Sens=IIf(PctVlt<0.5,0.5,
IIf( PctVlt>=0.5 AND PctVlt< 1.0 ,0.75,
IIf( PctVlt>=1.0 AND PctVlt< 1.5 ,1.00,
IIf( PctVlt>=1.5 AND PctVlt< 2.0 ,1.25,
IIf( PctVlt>=2.0 AND PctVlt< 2.5 ,1.50,
IIf( PctVlt>=2.5 AND PctVlt< 3.0 ,1.75,
IIf( PctVlt>=3.0 AND PctVlt< 3.5 ,2.00,
IIf( PctVlt>=3.5 AND PctVlt< 4.0 ,2.25,
2.50 ))))))));

Color=IIf(BarsSince(Cross(C,Ref(PK,-1)))<BarsSince(Cross(Ref(TGH,-1),C)),colorBrightGreen,colorRed);

Plot(C,"Chaloke.com Peak-Trough",Color,styleCandle);
//PlotShapes( Cross(C,Ref(PK,-1))*shapeUpArrow,colorYellow,0,L);
//PlotShapes( Cross(Ref(TGH,-1),C)*shapeDownArrow,colorPink,0,H);
PlotShapes( Cross(84,RSI(36))*shapeDownArrow,colorYellow,0,H,Offset=-28 );
//PlotShapes( Cross(67.4,RSI(171))*shapeDownArrow,colorYellow,0,H,Offset=-28 );
PlotShapes( Cross(27,RSI(95))*shapeUpArrow,colorYellow,0,L,Offset=-28 );

//PlotShapes(  Cross(95.9,StochD(4200))*shapeDownArrow,colorCustom12,0,H,Offset=-28 );
//PlotShapes(  Cross(0.50,StochD(4200))*shapeUpArrow,colorCustom12,0,H,Offset=-28 );


Pivot	=	ParamToggle("Pivot_day", "No|Yes", 1);

if(Pivot)
{
H1= TimeFrameGetPrice("H", inDaily, -1);		// yesterdays high
L1 = TimeFrameGetPrice("L", inDaily, -1);		//				low
C1= TimeFrameGetPrice("C", inDaily, -1);		//				close
Op = TimeFrameGetPrice("O", inDaily)-1;			// current day open

}
else
{
H1 = TimeFrameGetPrice("H", inDaily);		// yesterdays high
L1 = TimeFrameGetPrice("L", inDaily);		//				low
C1= TimeFrameGetPrice("C", inDaily);
Op = TimeFrameGetPrice("O", inDaily);			// current day open

}


// PIVOT Calculation
PP = (H1+ L1 +L1 + C1 )/4;


Plot(PP, "PP",colorWhite,4+8+2048 );
Plot( (H1),"HH",colorBrown,4+8+2048);
Plot( (L1),"LL",colorAqua,4+8+2048);

R  = (H1- L1);


R1 = PP + (R * 0.118);
R2 = PP + (R * 0.354);
R3 = PP + (R * 0.59);
R4 = PP + (R * 0.826);
R5 = PP + (R * 1.062);
R6 = PP + (R * 1.298);
R7 = PP + (R * 1.534);
R8 = PP + (R * 1.77);
R9 = PP + (R * 2.006);
R10 = PP + (R * 2.242);
R11 = PP +(R * 2.478);
R12 = PP +(R * 2.714);
R13 = PP +(R * 2.950);
R14 = PP +(R * 3.186);
R15 = PP +(R * 3.422);
R16 = PP +(R * 3.658);
R17 = PP +(R * 3.894);
R18 = PP +(R * 4.130);
R19 = PP +(R * 4.366);


S1 = PP - (R * 0.118);
S2 = PP - (R * 0.354);
S3 = PP - (R * 0.59);
S4 = PP - (R * 0.826);
S5 = PP - (R * 1.062);
S6 = PP - (R * 1.298);
S7 = PP - (R * 1.534);
S8 = PP - (R * 1.77);
S9 = PP - (R * 2.006);
S10 = PP - (R * 2.242);
S11 = PP -(R * 2.478);
S12 = PP -(R * 2.714);
S13 = PP -(R * 2.950);
S14 = PP -(R * 3.186);
S15 = PP -(R * 3.422);
S16 = PP -(R * 3.658);
S17 = PP -(R * 3.894);
S18 = PP -(R * 4.130);
S19 = PP -(R * 4.366);


base =(R2+S2)/2;


// woodies pivots
if ( False )
{
PP = ORBHigh- orblow;
R1  =  (2 * PP) - DayL;
S1  =  (2 * PP) - DayH;
R2  =  PP + (DayH - DayL);
S2  =  PP - (DayH - DayL);

R3  =  R1 + (DayH - DayL);
S3  =  R2 - (DayH - DayL);

R4  =  R2 + (DayH - DayL);
S4  =  R3 - (DayH - DayL);


}

// regular pivots
if ( False )
{
PP = (DayL + DayH + DayC)/3 ;
R1  =  (2 * PP) - DayL;
S1  =  (2 * PP)  - DayH;
R2  =  (PP - S1) + R1;
S2  =  PP - (R1 - S1);
}
Plot(PP, "PP",colorBlack,4+8+2048);
Plot(R1, "R1",colorBrown,styleDashed+styleNoRescale);
Plot(S1, "S1",colorAqua,styleDashed+styleNoRescale);
Plot(R2, "R2",colorCustom12,styleDashed+styleNoRescale);
Plot(S2, "S2",colorRed,styleDashed+styleNoRescale);
Plot(R3, "R3",colorBlue,styleDashed+styleNoRescale);
Plot(S3, "S3",colorBlue,styleDashed+styleNoRescale);
Plot(R4, "R4",colorCustom4,styleDashed+styleNoRescale);
Plot(S4, "S4",colorCustom4,styleDashed+styleNoRescale);
Plot(R5, "R5",colorCustom1,styleDashed+styleNoRescale);
Plot(S5, "S5",colorCustom1,styleDashed+styleNoRescale);
Plot(R6, "R6",colorBlue,styleDashed+styleNoRescale);
Plot(S6, "S6",colorBlue,styleDashed+styleNoRescale);
Plot(R7, "R7",colorViolet,styleDashed+styleNoRescale);
Plot(S7, "S7",colorViolet,styleDashed+styleNoRescale);
Plot(R8, "R8",colorCustom16,styleDashed+styleNoRescale);
Plot(S8, "S8",colorCustom16,styleDashed+styleNoRescale);
Plot(R9, "R8",colorTan,styleDashed+styleNoRescale);
Plot(S9, "S8",colorTan,styleDashed+styleNoRescale);

Plot(R10, "R10",colorRed,styleDashed+styleNoRescale);
Plot(S10, "S10",colorDarkBlue,styleDashed+styleNoRescale);
Plot(R11, "R11",colorViolet,styleDashed+styleNoRescale);
Plot(S11, "S11",colorViolet,styleDashed+styleNoRescale);
Plot(R12, "R12",colorViolet,styleDashed+styleNoRescale);
Plot(S12, "S12",colorViolet,styleDashed+styleNoRescale);
Plot(R13, "R13",colorViolet,styleDashed+styleNoRescale);
Plot(S13, "S13",colorViolet,styleDashed+styleNoRescale);
Plot(R14, "R14",colorViolet,styleDashed+styleNoRescale);
Plot(S14, "S14",colorViolet,styleDashed+styleNoRescale);
Plot(R15, "R15",colorViolet,styleDashed+styleNoRescale);
Plot(S15, "S1",colorViolet,styleDashed+styleNoRescale);
Plot(R16, "R16",colorViolet,styleDashed+styleNoRescale);
Plot(S16, "S16",colorViolet,styleDashed+styleNoRescale);

Plot(R17, "R17",colorViolet,styleDashed+styleNoRescale);
Plot(S17, "S17",colorViolet,styleDashed+styleNoRescale);
Plot(R18, "R18",colorViolet,styleDashed+styleNoRescale);
Plot(S18, "S18",colorViolet,styleDashed+styleNoRescale);
Plot(R19, "R19",colorViolet,styleDashed+styleNoRescale);
Plot(S19, "S19",colorViolet,styleDashed+styleNoRescale);


_SECTION_END();
Plot(EMA(C,20), "EMA21", colorBlue , styleLine|styleThick  );
Plot(EMA(C,10), "EMA13",colorYellow , styleLine|styleThick );
Plot(Wilders(H,260.6), "WILDERS",colorCustom12 ,styleDashed|styleNoRescale);

_SECTION_BEGIN("RSI BUY SELL");
n=45;
per =9;
x = Cum(1);
s1=IIf(RSIa(L,n)>Min(RSIa(C,n),RSIa(O,n)),Min(RSIa(C,n),RSIa(O,n)),RSIa(L,n));
s11=IIf(RSIa(H,n)<Max(RSIa(C,n),RSIa(O,n)),Max(RSIa(C,n),RSIa(O,n)),RSIa(H,n));
pS = TroughBars( s1, per, 1 ) == 0;
endt= LastValue(ValueWhen( pS, x, 1 ));
startt=LastValue(ValueWhen( pS, x, 2 ));
dtS =endt-startt;
endS = LastValue(ValueWhen( pS, s1, 1 ) );
startS = LastValue( ValueWhen( pS, s1, 2  ));
aS = (endS-startS)/dtS;bS = endS;
trendlineS = aS * ( x  -endt ) + bS;
pR = PeakBars( s11, per, 1 ) == 0;
endt1= LastValue(ValueWhen( pR, x, 1 ));
startt1=LastValue(ValueWhen( pR, x, 2 ));
dtR =endt1-startt1;
endR = LastValue(ValueWhen( pR, s11, 1 ) );
startR = LastValue( ValueWhen( pR, s11, 2  ));
aR = (endR-startR)/dtR;
bR = endR;
trendlineR = aR * ( x  -endt1 ) + bR;
//Plot(ValueWhen( (S1==trendlineS ), L),"", colorGreen, styleDashed|styleNoRescale|styleThick);
//Plot(ValueWhen((S11==trendlineR ), H),"", colorRed, styleDashed|styleNoRescale|styleThick);
Buy =  (S1==trendlineS );
Sell =  (S11==trendlineR );
Buy = ExRem( Buy, Sell );
Sell = ExRem( Sell, Buy );
PlotShapes( Buy * shapeUpArrow + Sell * shapeDownArrow, IIf( Buy, colorRed, colorCustom12) );
dist = 0.9*ATR(10);
for( i = 0; i < BarCount; i++ )
{
if( Buy[i] ) PlotText( "Rsi45 Buy " + L[ i ], i, L[ i ]-dist[i], colorWhite);
if( Sell[i] ) PlotText( "Rsi45 Sell " + H[ i ], i, H[ i ]+dist[i], colorCustom12);
}


_SECTION_END();


//Topping Bar
//Range = H - L ;
//TPB = Volume > MA(Volume,9) AND Close < Low + Range/2 AND Range <= Ref(Range,-1);
//PlotShapes(shapeSmallCircle * TPB,colorYellow,0,H,20);

_SECTION_BEGIN("Advanced Trend Lines");
function GetXSupport(Lo, Percentage, Back)
{
 return ((BarCount - 1) - LastValue(TroughBars(Lo, Percentage,Back)));
}
function GetYSupport(Lo, Percentage, Back)
{
 return (LastValue(Trough(Lo, Percentage, back)));
}

function GetXResistance(Hi, Percentage, Back)
{
 return ((BarCount - 1) -LastValue(PeakBars(Hi, Percentage, Back)));
}
function GetYResistance(Hi, Percentage, Back)
{
 return (LastValue(Peak(Hi, Percentage, Back)));
}
function TD_Supply(P)
{
	return ( P > Ref(P, 1) AND P > Ref(P, -1) AND P > Ref(C, -2));
}
function TD_Demand(P)
{
	return ( P < Ref(P, 1) AND P < Ref(P, -1) AND P < Ref(C, -2));
}
////////////////////////////////////////////////////////////////////////
//Parameters
Percentage 	= Param("Percentage", 5.55, 0.01, 100. ,0.01);
DrawAllLines 	= ParamToggle("Draw All Lines?", "No|Yes", 1);
Lines 			= Param("Lines?", 3, 1, BarCount-2);
DrawR 			= ParamList("Resistance Points", "Off|High to High|High to Low", 1);
DrawS 			= ParamList("Support Points", "Off|Low to Low|Low to High", 1);
ShowTDP 		= ParamToggle("Show TD Pionts", "No|Yes", 0);
AllOrDownR 	= ParamToggle("Resistance Direction", "All|Down");
AllOrUpS 		= ParamToggle("Support Direction", "All|Up");
ShowSR			= ParamToggle("Show Vert S/R","No|Yes", 1);
SRPer			= Param("S/R Percentage", 1.618, 1);
SRBack			= Param("S/R Back", 1, 1);
str = "";
Res = Sup = 0;
Con = 1;
////////////////////////////////////////////////////////////////////////
Main = C;
Con = ConS = ConR = 1;
if(DrawS=="Low to Low")
{
	Support1 = L;
	Support2 = L;
}
else
{
	Support1 = L;
	Support2 = H;
}
if(DrawR=="High to High")
{
	Resistance1 = H;
	Resistance2 = H;
}
else
{
	Resistance1 = H;
	Resistance2 = L;
}
////////////////////////////////////////////////////////////////////////
//Plotting Area
Plot(Main, "", IIf(C>O,colorGreen, colorRed), styleBar);
if(DrawAllLines)
for(i = 2; i<=Lines+1; i++)
{
	if(DrawS!="Off")
	{
		x0 = GetXSupport(Support1, Percentage, i);
		x1 = GetXSupport(Support2, Percentage, i-1);
		y0 = GetYSupport(Support1, Percentage, i);
		y1 = GetYSupport(Support2, Percentage, i-1);
		x = LineArray(x0, y0, x1, y1, 1);
		if(AllOrUpS) ConS = StrToNum(NumToStr(y0 < y1));
		if(Con AND ConS)
			Plot(x, "", IIf(LastValue(C) < LastValue(x), colorBlue,colorYellow),4+8+2048);

	}
	if(DrawR!="Off")
	{
		x0 = GetXResistance(Resistance1, Percentage, i);
		x1 = GetXResistance(Resistance2, Percentage, i-1);
		y0 = GetYResistance(Resistance1, Percentage, i);
		y1 = GetYResistance(Resistance2, Percentage, i-1);
		x = LineArray(x0, y0, x1, y1, 1);
		if(AllOrDownR) ConR = y0 > y1;
		if(Con AND ConR)
			Plot(x, "",  IIf(LastValue(C) < LastValue(x), colorBlue,colorYellow),4+8+2048);

	}
}
else
{
	if(DrawS!="Off")
	{
		x0 = GetXSupport(Support1, Percentage, Lines+1);
		x1 = GetXSupport(Support2, Percentage, Lines);
		y0 = GetYSupport(Support1, Percentage, Lines+1);
		y1 = GetYSupport(Support2, Percentage, Lines);
		x = LineArray(x0, y0, x1, y1, 1 );
		Sup = LastValue(LinRegSlope(x, Lines+1));
		if(AllOrUpS) ConS = y0 < y1;
		if(Con AND ConS)
			Plot(x, "", IIf(LastValue(C) < LastValue(x), colorBlue,colorYellow),4+8+2048);

	}
	if(DrawR!="Off")
	{
		x0 = GetXResistance(Resistance1, Percentage, Lines+1);
		x1 = GetXResistance(Resistance2, Percentage, Lines);
		y0 = GetYResistance(Resistance1, Percentage, Lines+1);
		y1 = GetYResistance(Resistance2, Percentage, Lines);
		x = LineArray(x0, y0, x1, y1, 1 );
		Res = LastValue(LinRegSlope(x, Lines+1));
		if(AllOrDownR) ConR = y0 > y1;
		if(Con AND ConR)
			Plot(x, "",  IIf(LastValue(C) < LastValue(x), colorBlue,colorYellow),4+8+2048);

	}
str = "\nR Slope=("+Res+"), S Slope=("+Sup+")";
}

if(ShowTDP)
{
	PlotShapes(TD_Supply(H)*shapeSmallCircle, colorRed, 0, H, H*.001);
	PlotShapes(TD_Demand(L)*shapeSmallCircle, colorGreen, 0, L, -L*.001);
}
if(ShowSR)
{
	for(i=1; i<=SRBack; i++)
	{
		x0 = GetXSupport(L, SRPer, i);
		x1 = BarCount-1;
		y0 = GetYSupport(L, SRPer, i);
		x = LineArray(x0, y0, x1, y0, 0);
		//Plot(x, "", IIf(LastValue(C) > x, colorCustom13, colorCustom12), 4+8+2048);

		x0 = GetXResistance(H, SRPer, i);
		y0 = GetYResistance(H, SRPer, i);
		x = LineArray(x0, y0, x1, y0, 0);
		//Plot(x, "", IIf(LastValue(C) > x, colorCustom13, colorCustom12), 4+8+2048);


	}
}
Title =FullName()+" ({{NAME}})\n{{DATE}}\n"+"Open: "+O+", Hi: "+H+", Lo: "+L+", Close: "+C+StrFormat(" (%.2f  %.2f\%)", C-Ref(C, -1), SelectedValue(ROC(C, 1)))+str;


_SECTION_END();

_SECTION_BEGIN("Background");
	SetChartOptions(0,chartShowArrows|chartShowDates);
	SetChartBkColor(ParamColor("Outer panel",colorBlack)); // color of outer border
	SetChartBkGradientFill( ParamColor("Inner panel upper",colorBlack),ParamColor("Inner panel lower",colorBlack));
	tchoice=Param("Title Selection ",2,1,2,1);

//Plot(C, "", IIf(O>=C, colorOrange, colorGreen), ParamStyle("Price Style",styleBar,maskPrice));
//////////////////////////////////////////////////////////////////
_SECTION_BEGIN("Fib Retracements");
	fibs = ParamToggle("Plot Fibs","Off|On",1);
	pctH = Param ("Pivot Hi %", 1.618,0.001,2.0,0.002);
	HiLB = Param ("Hi LookBack",1,1,BarCount-1,1);
	pctL = Param ("Pivot Lo %", 1.618,0.001,2.0,0.002);
	LoLB = Param ("Lo LookBack",1,1,BarCount-1,1);
	Back = Param ("Extend Left = 2",1,1,500,1);
	Fwd  = Param("Plot Forward", 0, 0, 500, 1);
	text = ParamToggle("Plot Text","Off|On",1);
	hts  = Param ("Text Shift", -33.5,-50,50,0.10);
	style =ParamStyle("Line Style",styleLine,styleNoLabel);
x = BarIndex();
pRp  = PeakBars( H, pctH, 1) == 0;
yRp0 = SelectedValue(ValueWhen( pRp, H, HiLB));
xRp0 = SelectedValue(ValueWhen( pRp, x, HiLB));
pSp  = TroughBars( L, pctL, 1) == 0;
ySp0 = SelectedValue(ValueWhen( pSp, L, LoLB));
xSp0 = SelectedValue(ValueWhen( pSp, x, LoLB));
Delta = yRp0 - ySp0;

function fib(ret)
{
retval = (Delta * ret);
Fibval = IIf(ret < 1.0
AND xSp0 < xRp0, yRp0 - retval, IIf(ret < 1.0
AND xSp0 > xRp0, ySp0 + retval,IIf(ret > 1.0
AND xSp0 < xRp0, yRp0 - retval, IIf(ret > 1.0
AND xSp0 > xRp0, ySp0 + retval, Null))));
return FibVal;
}

x0 = Min(xSp0,xRp0)-Back;
x1 = (BarCount -1);
//////////////////////////////////////////////////////////////////
r236 = fib(0.236);	r236I = LastValue (r236,1);
r382 = fib(0.382);	r382I = LastValue (r382,1);
r050 = fib(0.50);		r050I = LastValue (r050,1);
r618 = fib(0.618);	r618I = LastValue (r618,1);
r786 = fib(0.786);	r786I = LastValue (r786,1);
e127 = fib(1.27);		e127I = LastValue (e127,1);
e162 = fib(1.62);		e162I = LastValue (e162,1);
e200 = fib(2.00);		e200I = LastValue (e200,1);
e262 = fib(2.62);		e262I = LastValue (e262,1);
e424 = fib(4.24);		e424I = LastValue (e424,1);
//////////////////////////////////////////////////////////////////
p00 = IIf(xSp0 > xRp0,ySp0,yRp0); 	p00I = LastValue (p00,1);
p100 = IIf(xSp0 < xRp0,ySp0,yRp0); 	p100I = LastValue (p100,1);
color00 =IIf(xSp0 > xRp0,colorLime,colorRed);
color100 =IIf(xSp0 < xRp0,colorLime,colorRed);
//////////////////////////////////////////////////////////////////
numbars = LastValue(Cum(Status("barvisible")));
fraction= IIf(StrRight(Name(),3) == "", 3.2, 3.2);
//////////////////////////////////////////////////////////////////
if(fibs==1)
{
//Plot(LineArray(xRp0-Fwd,yRp0,x1,yRp0,Back),"PR",32,8|styleNoRescale,Null, Null,Fwd);
//Plot(LineArray(xSp0-Fwd,ySp0,x1,ySp0,Back),"PS",27,8|styleNoRescale,Null, Null,Fwd);
//Plot(LineArray(x0-Fwd,r236,x1,r236,Back),"",45,style|styleNoRescale,Null, Null,Fwd);
//Plot(LineArray(x0-Fwd,r382,x1,r382,Back),"",44,style|styleNoRescale,Null, Null,Fwd);
//Plot(LineArray(x0-Fwd,r050,x1,r050,Back),"",41,style|styleNoRescale,Null, Null,Fwd);
//Plot(LineArray(x0-Fwd,r618,x1,r618,Back),"",43,style|styleNoRescale,Null, Null,Fwd);
//Plot(LineArray(x0-Fwd,r786,x1,r786,Back),"",42,style|styleNoRescale,Null, Null,Fwd);
//Plot(LineArray(x0-Fwd,e127,x1,e127,Back),"e127",47,style|styleNoRescale,Null, Null,Fwd);
//Plot(LineArray(x0-Fwd,e162,x1,e162,Back),"e162",47,style|styleNoRescale,Null, Null,Fwd);
//Plot(LineArray(x0-Fwd,e200,x1,e200,Back),"p200",47,style|styleNoRescale,Null, Null,Fwd);
//Plot(LineArray(x0-Fwd,e262,x1,e262,Back),"p262",47,style|styleNoRescale,Null, Null,Fwd);
//Plot(LineArray(x0-Fwd,e424,x1,e424,Back),"p424",25,style|styleNoRescale,Null, Null,Fwd);
}
//////////////////////////////////////////////////////////////////
if(text==1)
{
PlotText(" 0% = " + WriteVal(p00,fraction), 	LastValue(BarIndex())-(numbars/hts), p00I  + 0.05, color00);
PlotText("23% = " + WriteVal(r236,fraction), LastValue(BarIndex())-(numbars/hts), r236I + 0.05, 45);
PlotText("38% = " + WriteVal(r382,fraction), LastValue(BarIndex())-(numbars/hts), r382I + 0.05, 44);
PlotText("50% = " + WriteVal(r050,fraction), LastValue(BarIndex())-(numbars/hts), r050I + 0.05, 41);
PlotText("62% = " + WriteVal(r618,fraction), LastValue(BarIndex())-(numbars/hts), r618I + 0.05, 43);
PlotText("78% = " + WriteVal(r786,fraction), LastValue(BarIndex())-(numbars/hts), r786I + 0.05, 42);
PlotText("100% = " + WriteVal(p100,fraction), LastValue(BarIndex())-(numbars/hts),p100I + 0.05, color100);
PlotText("127% = " + WriteVal(e127,fraction), LastValue(BarIndex())-(numbars/hts),e127I + 0.05, 47);
PlotText("162% = " + WriteVal(e162,fraction), LastValue(BarIndex())-(numbars/hts),e162I + 0.05, 47);
PlotText("200% = " + WriteVal(e200,fraction), LastValue(BarIndex())-(numbars/hts),e200I + 0.05, 47);
PlotText("262% = " + WriteVal(e262,fraction), LastValue(BarIndex())-(numbars/hts),e262I + 0.05, 47);
PlotText("424% = " + WriteVal(e424,fraction), LastValue(BarIndex())-(numbars/hts),e424I + 0.05, 25);
}
_SECTION_END();
//////////////////////////////////////////////////////////////////
if (tchoice==1 )
{
_N(Title = EncodeColor(colorWhite)+StrFormat(" {{NAME}} -   {{INTERVAL}}      {{DATE}}    Open:  %g,    High:  %g,     Low:  %g,     Close:  %g     {{VALUES}}",O, H, L, C, SelectedValue( ROC( C, 1   ) ) ));
}
//////////////////////////////////////////////////////////////////
if (tchoice==2 )
{
Title = EncodeColor(colorWhite)+  Date() + "   Tick = " + EncodeColor(5) + Interval()+
EncodeColor(colorWhite) + "     Open = " + EncodeColor(colorWhite) + O +
EncodeColor(colorWhite) + "     High = " + EncodeColor(5) + H +
EncodeColor(colorWhite) + "      Low = " + EncodeColor(colorRed) + L +
EncodeColor(colorWhite) + "     Close = " + EncodeColor(colorWhite) + C + "\n" +
EncodeColor( colorWhite) +"_______________"+"\n"+
EncodeColor( colorWhite)  + "424%   =  "	+ 	EncodeColor(25)+ e424 + " " +"\n"+
EncodeColor( colorWhite)  + "262%   =  "	+ 	EncodeColor(47)+ e262 + " " +"\n"+
EncodeColor( colorWhite)  + "200%   =  "	+ 	EncodeColor(47)+ e200 + " " +"\n"+
EncodeColor( colorWhite)  + "162%   =  "	+ 	EncodeColor(47)+ e162 + " " +"\n"+
EncodeColor( colorWhite)  + "127%   =  "	+ 	EncodeColor(47)+ e127 + " " +"\n"+
EncodeColor( colorYellow) + "  Res    =  "	+ 	EncodeColor(32)+ p100 + " " +"\n"+
EncodeColor( colorWhite)  + "  78%   =  "	+	EncodeColor(42)+ r786 + " " +"\n"+
EncodeColor( colorWhite)  + "  62%   =  "	+ 	EncodeColor(43)+ r618 + " " +"\n"+
EncodeColor( colorWhite)  + "  50%   =  "	+ 	EncodeColor(41)+ r050 + " " +"\n"+
EncodeColor( colorWhite)  + "  38%   =  "	+ 	EncodeColor(44)+ r382 + " " +"\n"+
EncodeColor( colorWhite)  + "  23%   =  "	+ 	EncodeColor(45)+ r236+ " " +"\n"+
EncodeColor( colorYellow) + "  Sup   =   "	+ 	EncodeColor(34)+ p00 + " " ;
}
GraphXSpace=5;
12 comments
Leave Comment
Please login here to leave a comment.
Hi !! It seems to be a nice chart but while putting it my AB its not showing up anything. Can you please help if I need to set anything. As other afl working fine.
Thanks,
Atul
2. A lot of code and high expectations. I added “Exploration” but did not get any "Buy"signals from 3800 stocks. Below is code I Used:
Action = WriteIf(Buy, “BUY”, WriteIf(Sell, “SELL”, " “));
Result = WriteIf(Buy,”Buy",“Sell”);
AddTextColumn( WriteIf(Buy, “Buy” , “Sell” ) , “TRADE” , 5 , IIf(Buy,colorYellow, colorWhite), IIf(Buy, colorDarkGreen, colorRed) );
AddTextColumn(IndustryID(1) ,"Industry Sector ", 25.0, colorWhite, colorBlue, 125);// adds a column for the industry sector
AddColumn(C, “Close”, 3.2, colorBlue, colorYellow, 55); // adds a column for today’s close
AddColumn(Ref(Close,-1),“Y-Close”,1.2, IIf( ROC,1)>=0,colorDarkGreen, colorRed ),50 );
AddColumn( ROC, “ROC”, 1.2, IIf( ROC >= 0,colorDarkGreen, colorRed));
AddColumn(V, “VOLUME”,8.0, colorYellow, colorDarkGreen, 75);// adds a column for today’s volume
Dick H
hello rajasamwy
my amibroker this error apear in
x1=IIf(Cloc=0,arg,x);
line 24 col 14 warning 501 assignment with conditional did you mean =instead of ===
Please help me
Thanks
hello rajasamy
it is use only hourly or end of day chart
hi rajaswami
i had this afl from akshar technical.com. This is so good but delayed buy or sell signals. In that akshar afl also like that. Please modify and rewrite the afl as coming immediate signals. if u do so its very good and best afl. Upto now the best afl is beast auto signals afl is the best. Dear treaders try the beast autosingals afl. k bye
hi gangadhar,
can you give the link for beast auto signal afl. thanks.
hi prakash2009, the beast auto signal afl is in this website go to indicator pastie then search in that. The best afl fr all the afl s. Now i am using somany afls but this is the best in 5min time frame.
use this indicator for entry lvl and use guppy ultimate for exit.
i have tested it 3 days …gave excellent results .
99% accuracy
you are saying 99%accuracy.It gives a very delayed signal.not at all meant for trading.Rajaswamy is saying its a nifty magic. are you people are joking.Guppy ultimate another one is a lagging indicator.Can you give your yahoo id.
rajaswamym&yahoo.com add my id and call me mr.prakash
I agree the signals in NIFTY CLINIC afl are delayed and change.. beast afl is better.
hello rajasamwy
my amibroker this error apear in
x1=IIf(Cloc=0,arg,x);
line 24 col 14 warning 501 assignment with conditional did you mean =instead of ===
Please help me
Thanks