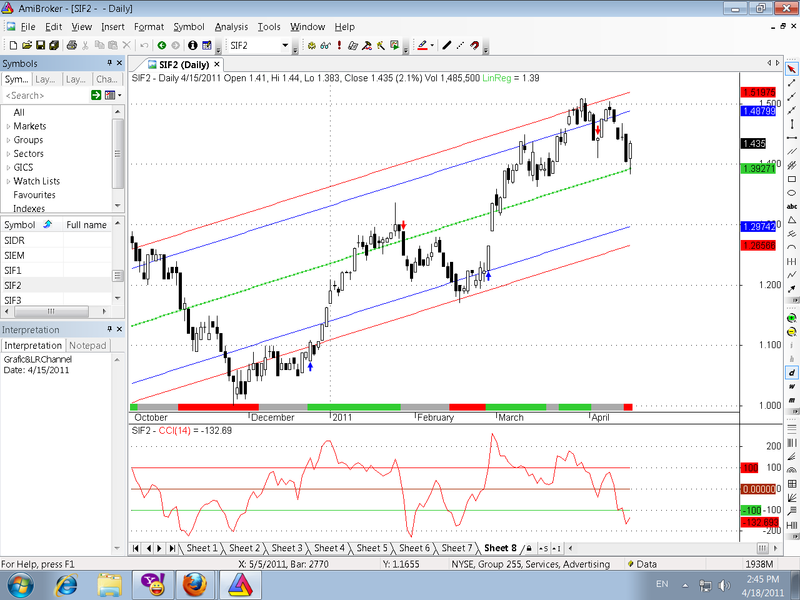
Grafic & Linear Regression Channel for Amibroker (AFL)
morgen over 15 years ago Amibroker (AFL)
With some improvements and buy/sell signals.
Screenshots
Indicator / Formula
Copy & Paste Friendly
//CyberMan's Linear Regression Channel.

//Linear Regression Line with 2 Standard Deviation Channels Plotted Above and Below
//The original was written by Patrick Hargus, with critical hints from Marcin Gorzynski, Amibroker.com Technical Support
//Wysiwyg coded the angle in degrees part
//I modified the original Linear Regression code so that the line will change color based on the degree of the Linear Regression slope.
//I combine this with my trading system.
//When my system gives an entry signal I look at the Linear Regression Line and I will only take long positions
//if the Linear Regression line is green AND the entry price is below the LR line.
//When my system gives an entry signal I look at the Linear Regression Line and I will only take short positions
//if the Linear Regression line is red AND the entry price is above the LR line.
//It is usefull for filtering out lower probability trades.


//================================================Start Chart Configuration======================================================
SetChartOptions(0,chartShowArrows|chartShowDates);
_N(Title = StrFormat("{{NAME}} - {{INTERVAL}} {{DATE}} Open %g, Hi %g, Lo %g, Close %g (%.1f%%) Vol " +WriteVal( V, 1.0 ) +
           " {{VALUES}}", O, H, L, C, SelectedValue( ROC( C, 1 )) ));
//SetChartBkColor(colorBlack);

Plot( C, "", colorBlack, styleCandle, Zorder = 1);
SetChartOptions(0,chartShowArrows | chartShowDates);

//================================================End Chart Configuration========================================================


//====================================Start of Linear Regression Code============================================================

P = ParamField("Price field",-1);

Length = 150;

Daysback = Param("Period for Liner Regression Line",Length,1,240,1);
shift = Param("Look back period",0,0,240,1);

//=============================== Math Formula =================================================================================
x = Cum(1);
lastx = LastValue( x ) - shift;
aa = LastValue( Ref(LinRegIntercept( p, Daysback), -shift) );
bb = LastValue( Ref(LinRegSlope( p, Daysback ), -shift) );
y = Aa + bb * ( x - (Lastx - DaysBack +1 ) );

//==================Plot the Linear Regression Line ============================================================================

LRColor = ParamColor("LR Color", colorCycle );
LRStyle = ParamStyle("LR Style");

LRLine =  IIf( x > (lastx - Daysback) AND BarIndex() < Lastx, y, Null );

LRStyle = ParamStyle("LR Style");
Angle = Param("Angle", 0.05, 0, 1.5, 0.01);// A slope higher than 0.05 radians will turn green, less than -0.05 will turn red
                                           // AND anything in between will be white.

LRLine = IIf( x > (lastx - Daysback) AND BarIndex() < Lastx, y, Null );

Pi = 3.14159265 * atan(1); // Pi
SlopeAngle = atan(bb)*(180/Pi);

LineUp = SlopeAngle > Angle;
LineDn = SlopeAngle < - Angle;

if(LineUp)
{
//Plot(LRLine, "Lin. Reg. Line Up", IIf(LineUp, colorLime, colorWhite), LRStyle);
}
else
{
//Plot(LRLine, "Lin. Reg. Line Down", IIf(LineDn, colorRed, colorWhite), LRStyle);
}

//==========================  Plot 1st SD Channel =============================================================================

SDP = Param("Standard Deviation", 1.5, 0, 6, 0.1);
SD = SDP/2;

width = LastValue( Ref(SD*StDev(p, Daysback),-shift) ); //Set width of inside chanels here.
SDU = IIf( x > (lastx - Daysback) AND BarIndex() < Lastx, y+width , Null ) ;
SDL = IIf( x > (lastx - Daysback) AND BarIndex() < Lastx, y-width , Null ) ;

SDColor = ParamColor("SD Color", colorCycle );
SDStyle = ParamStyle("SD Style");

Plot( SDU , "", colorBlue,SDStyle ); //Inside Regression Lines
Plot( SDL , "", colorBlue,SDStyle ); //Inside Regression Lines

//==========================  Plot 2d SD Channel ===============================================================================

SDP2 = Param("2d Standard Deviation", 2.0, 0, 6, 0.1);
SD2 = SDP2/2;

width2 = LastValue( Ref(SD2*StDev(p, Daysback),-shift) ); //Set width of outside chanels here.
SDU2 = IIf( x > (lastx - Daysback) AND BarIndex() < Lastx, y+width2 , Null ) ;
SDL2 = IIf( x > (lastx - Daysback) AND BarIndex() < Lastx, y-width2 , Null ) ;

SDColor2 = ParamColor("2 SD Color", colorCycle );
SDStyle2 = ParamStyle("2 SD Style");

Plot( SDU2 , "", colorRed,SDStyle2 ); //OutSide Regression Lines
Plot( SDL2 , "", colorRed,SDStyle2 ); //OutSide Regression Lines

Trend = IIf(LRLine > Ref(LRLine,-1),colorLime,colorRed);//Changes LR line to green if sloping up and red if sloping down.

Plot( LRLine , "LinReg", Trend, styleDots );

//============================ End Indicator Code =======================================================================

//TRENDING RIBBON
// Paste the code below to your price chart somewhere and green ribbon means both
// both MACD and ADX trending up so if the red ribbon shows up the MACD and the ADX
// are both trending down.
_SECTION_BEGIN("trending ribbon");
uptrend=PDI()>MDI() AND MACD()>Signal();
downtrend=MDI()>PDI() AND Signal()>MACD();
Plot( 2, /* defines the height of the ribbon in percent of pane width */"",
IIf( uptrend, colorLime, IIf( downtrend, colorRed, 0 )), /* choose color */
styleOwnScale|styleArea|styleNoLabel, -0.5, 100 );
_SECTION_END();
//xxxxxxxxxxxxxxxxxxxxxxxxxxxxxxxxxxxxxxxxxxxxxxxxxxxxxxxxxxxxxxxxxxxxxxxxxxxxxxxxxxxxxxxxxxxxxxxxxxxxxxxxx

//FORMULE
P = ParamField("Price field",-1);
cuptop1= C>BBandTop(p,20,1) ;
bot1= BBandBot(p,20,1) ;
top2= BBandTop(p,20,2) ;
bot2= BBandBot(p,20,2) ;
stochup= StochK()>StochD() ;
MACDup= MACD()>Signal() ;
Hist= MACD()-Signal() ;
Histup= Hist>Ref(Hist,-1) ;
MFIupema5= MFI()>EMA(MFI(),5) ;
top1up= BBandTop(p,20,1)>Ref(BBandTop(p,20,1),-1) ;
band= BBandTop(p,20,2)-BBandBot(p,20,2) ;
Volatbuy= band>Ref(band,-1) ;
cupbot1= C>BBandBot(p,20,1) ;
bot1dn= BBandBot(p,20,1)<Ref(BBandBot(p,20,1),-1) ;
CCIup0= CCI()>0 ;
Cupma10= C>MA(C,10) ;
Cupma20= C>MA(C,20) ;
MA10up= MA(C,10)>Ref(MA(C,10),-1) ;
MA10upma20= MA(C,10)>MA(C,20) ;
MA20up= MA(C,20)>Ref(MA(C,20),-1) ;
Cupema50= C>EMA(C,50) ;
Vup= V>10000 AND C>O ;
trendup= LRLine>Ref(LRLine,-1) ;
Cdnlrl= C<LRLine ;
//xxxxxxxxxxxxxxxxxxxxxxxxxxxxxxxxxxxxxxxxxxxxxxxxxxxxxxxxxxxxxxxxxxxxxxxxxxxxxxxxxxxxxxxxxxxxxxxxxxxxxxx

myBuy   = Cross(PDI(),MDI()) AND MACD()>Signal() AND Hist>Ref(Hist,-1) AND LRLine>Ref(LRLine,-1) AND C<LRLine ;
myShort = Cross(0,CCI()) AND Signal()>MACD() ;

Buy = ExRem(myBuy, myShort);
Sell = ExRem(myShort, myBuy);

PlotShapes(IIf(Buy,shapeUpArrow,shapeNone),colorBlue,0,L,Offset=-10);
PlotShapes(IIf(Sell,shapeDownArrow,shapeNone),colorRed,0,H,Offset=-10);
//END OF xxxxxxxxxxxxxxxxxxxxxxxxxxxxxxxxxxxxxxxxxxxxxxxxxxxxxxxxxxxxxxxxxxxxxxxxxxxxxxxxxxxxxxxx
4 comments
Leave Comment
Please login here to leave a comment.
No buy sell arrows coming in 5 min chart.
I think, it is for EOD investors only.
nice one
Very Nice.