V2.BULL BEAR CROSSOVER for Amibroker (AFL)
chatpurpose about 12 years ago Amibroker (AFL)
Hi…inadvertently, I used the variable “C” at lines 6,8 in my earlier
version of BULL BEAR CROSSOVER. Since “C” refers to “close”, I shouldnt have
used it. Though the indicator is giving good results, My thought of the
indicator was perhaps wrongly represented. Hence, I made this VERSION 2. This is
only the replacing C with some other letter. The indicator has become slightly
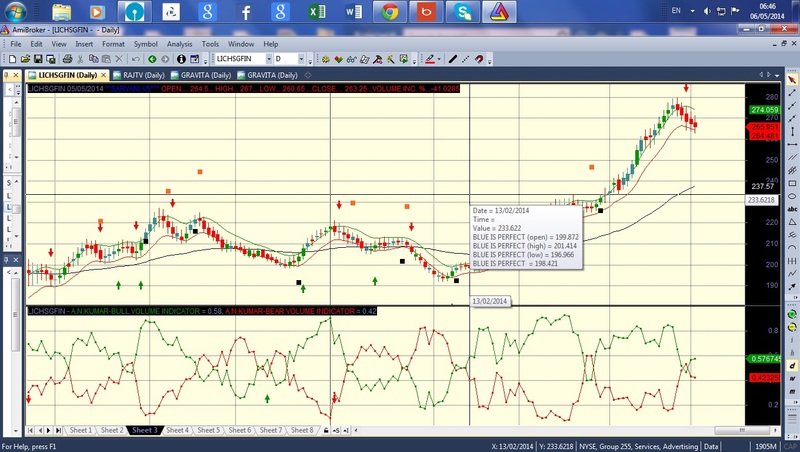
slow, but confusion at BUBBLE SQUEEZE area is vastly removed. Kindly check.
Screenshots
Indicator / Formula
Copy & Paste Friendly
X=((C-Ref(C,-1))/(HHV(H,2)-LLV(L,2)));
A=0;
A=IIf(C>Ref(C,-1),A+(X*V),A+0);/*portion of bull volume*/

B=0;
B=IIf(C<=Ref(C,-1),B+(X*V),B+0);/*portion of bear volume*/
I=Sum(A,10);
D=Sum(B,10);
E=(I/(I-D));


F=-(D/(I-D));


G=0;
H=0;


Buy=Cross(E,F) AND EMA(E,5)>EMA(E,10) AND E>0.55;

Sell=E<0.85 AND Ref(E,-1)>0.85  ;
Buy=ExRem(Buy,Sell);
Sell=ExRem(Sell,Buy);


shbuy=Buy*shapeUpArrow;

shsell=Sell*shapeDownArrow;

Plot(E,"A.N.KUMAR-BULL VOLUME INDICATOR",colorGreen,style=styleDots);

Plot(F,"A.N.KUMAR-BEAR VOLUME INDICATOR",colorRed,style=styleDots);
PlotShapes(Buy*shapeUpArrow,colorGreen,Layer=0,yposition=H,Offset=50);
PlotShapes(Sell*shapeDownArrow,colorRed,Layer=0,yposition=H,Offset=-50);
4 comments
Leave Comment
Please login here to leave a comment.
Hi, Thanks for sharing the indicator.
Also can you please let us know best time frame & stocks for which indicator performance is good.
Hi..the indicator was based on EOD DATA. But, I strongly believe, it should work
for intraday also.
Respected admin, I want to provide a revised code for choosing custom period through parameter. I tried earlier by giving here, but it is not pasting properly. If possible, kindly help.
sir, thanks a lot for the help